
On Jan. 7, 2026, the Bureau of Labor Statistics released the state employment data for October and November 2025, which had been delayed by a federal government shutdown. The data showed that the District lost 18,400 jobs between September and October and a further 600 in November. Much of that loss was driven by federal job losses (15,300) resulting from the Deferred Resignation Program, announced earlier in 2025 as part of the federal government’s efforts to reduce the federal workforce. Between September and October, 1,300 jobs were lost in the Professional Business Services sector, where most jobs are held by federal government contractors, followed by an additional 700 in November. The steep job losses since September leave jobs in the District at 739,200, a level not seen since the year following the lows of the COVID-19 pandemic.
| Jan 2025 | Sep 2025 | Oct 2025 | Nov 2025(p) | Change | ||
|---|---|---|---|---|---|---|
| Sep to Oct | Jan to Nov | |||||
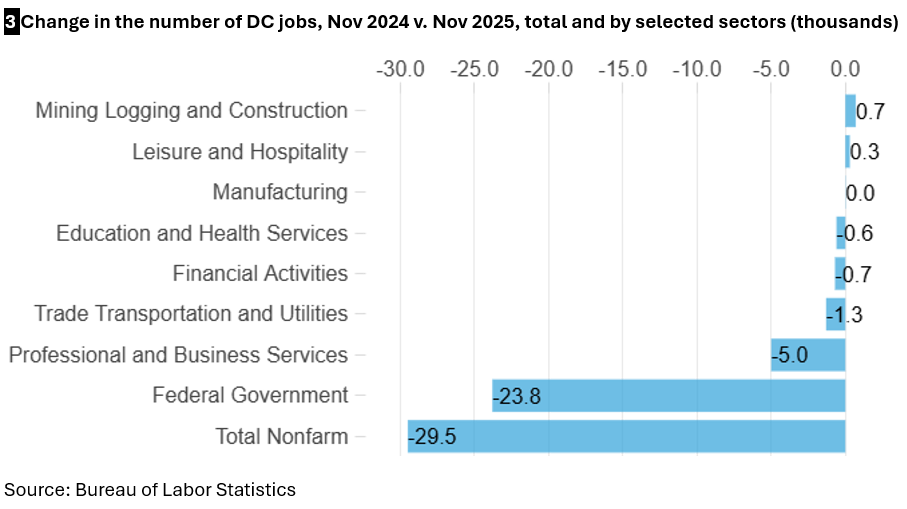
| Total | 768.7 | 758.2 | 739.8 | 739.2 | -18.4 | -29.5 |
| Construction | 14.9 | 15.4 | 15.5 | 15.6 | 0.1 | 0.7 |
| Leisure and Hospitality | 77.9 | 77.8 | 78.2 | 78.2 | 0.4 | 0.3 |
| Manufacturing | 1.2 | 1.3 | 1.2 | 1.2 | -0.1 | 0.0 |
| Education and Health | 125.8 | 126.1 | 125.5 | 125.2 | -0.6 | -0.6 |
| Finance | 25.8 | 25.1 | 25 | 25.1 | -0.1 | -0.7 |
| Trade, Transportation, and Utilities | 29.7 | 28.9 | 28.6 | 28.4 | -0.3 | -1.3 |
| Professional and Business Services | 171.9 | 168.9 | 167.6 | 166.9 | -1.3 | -5.0 |
| Federal Government | 192.8 | 184.7 | 169.4 | 169 | -15.3 | -23.8 |
Although the current federal workforce downsizing is a nationwide phenomenon, as Chart 1 illustrates, it has had a disproportionate impact on the District and the DC metro area due to the region's high concentration of federal workers (Chart 2). In November, federal jobs were 88.9% of their January 2025 levels nationwide, 86.3% in the DC metro area, and 87.7% in the District. While total nonfarm jobs nationwide remain near their January 2025 levels, the DC metro area's total jobs were at 98.5% of their January level, and the District's total jobs were at 96.2% of their January level (Figure 2), underscoring the greater impact of federal workforce cuts on the District's job market compared with the nation and the region.


Table 1 and Chart 3 show job losses by sector over the past year. District job growth had slowed to a trickle even before the current administration’s aggressive cuts to federal jobs. The trend became more pronounced at the start of 2025, driven by the administration’s Department of Government Efficiency and other federal actions to reduce the size of the federal workforce. District job losses accelerated in October, when the Deferred Resignation Program, under which thousands of federal workers agreed to voluntary separation, took effect. Jobs in other District sectors, such as Professional and Business Services, Leisure and Hospitality, and Health and Education, also declined or posted only slight gains over the past year. This is evidence of a broader economic slowdown in the District, as federal workforce cuts and other federal policies constrain growth.
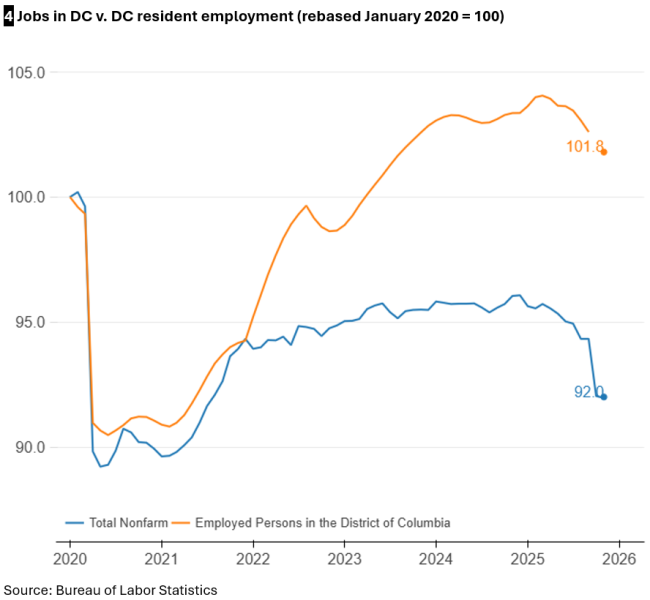
One surprising element of the November employment report is that District residents did not fare as badly as one might expect, given job declines in the District and its metro area. Between January and November, the civilian labor force fell only slightly, and District resident employment fell 1.8%, less than half the 3.8% loss in District jobs over the period (Table 2). Zooming out over a longer time frame, we see that District resident employment is 1.8% above its pre-pandemic level, despite District jobs at 92% of their pre-pandemic level (Chart 4). This is primarily because the District resident job recovery was much stronger than the recovery of jobs located in the District. Even so, as the civilian labor force is shrinking more slowly than employment, the unemployment rate has risen from 5.3% in January to 6.5% in November.
| Jan-25 | Nov-25 | Change | ||
|---|---|---|---|---|
| Amount | Percent | |||
| Civilian Labor Force | 418,255 | 416,140 | -2,115 | -0.5% |
| Employed Residents | 395,955 | 388,891 | -7,064 | -1.8% |
After almost a year of another federal workforce downsizing, the latest employment report for DC shows that federal workforce cuts and other federal policies have disproportionately affected DC’s job market, slowing growth across multiple sectors and signaling a broader economic slowdown. Despite these losses, District residents fared relatively better, with resident employment declining more slowly than overall District jobs and remaining above pre-pandemic levels.
What is this data?
This analysis is based on employment statistics from the US Bureau of Labor Statistics (BLS), retrieved from the Federal Reserve Bank of St. Louis's Federal Reserve Economic Database (FRED®).