
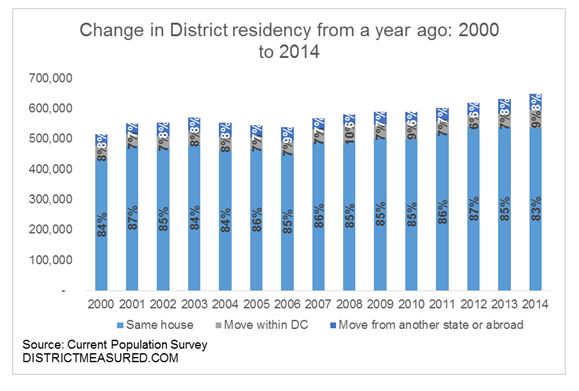
The District added about 90,000 net new residents between 2000 and 2014, but the population churn has been great. Current Population Survey data show that more than half a million people report moving to the District from some other state or jurisdiction during that period—this is on average 8 percent of the city’s resident population every year. Residents also move within the city frequently: In 2014, for example, nearly 60,000 residents moved houses within the city—this is approximately 9 percent of District’s resident population.
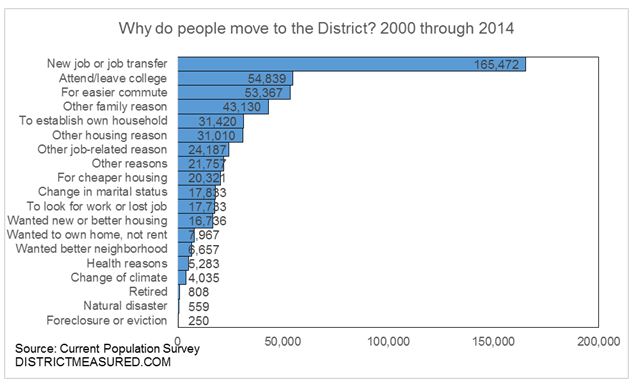
Jobs—or the prospect of one—is the top reason why the District receives new residents from other states. Between 2000 and 2014, the District received nearly 165,000 new residents because either they got a job in the District or their job was relocated in the District. Another 55,000 moved here to attend college, or they had just completed college, and found the District to be an attractive job market. Not all of these newcomers stayed, but it is interesting to see that over 42 percent of District residents who had moved to the city sometime in the previous 12-month period did so for their careers. Convenience of living in the city follows jobs, with another 10 percent of District residents suggesting that they moved into the city for an easier commute.
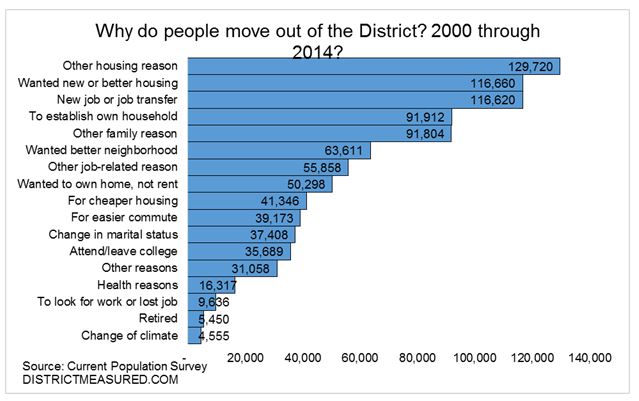
Why do people move out? It is housing. The top two reasons people report moving out the District in the last fifteen years have to do with wanting better housing, seeking cheaper housing, or wanting to own a house, for example, and these reasons account for 36 percent of the moves out of the District whereas they account for only 12 percent of the moves into the District. Jobs however, account for 12 percent of the people moving out compared to 32 percent moving in.
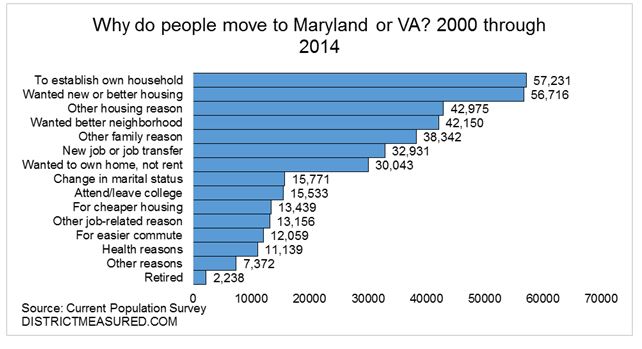
Incidentally, suburbs do a better job in attracting District residents than the other way around. Between 2000 and 2011, the District sent 391,000 of its residents to Maryland or Virginia (42 percent of those who left the city), but received only 191,000 new residents from these two states (30 percent of the residents who moved into the city). Looking at the reasons why people move to the suburbs, housing still plays a role, but the top reason is to establish a household. It appears from the data that those who share housing in the District with roommates are most likely to move out to the suburbs when they want a place of their own.
What exactly is this data?
Data on move rates are extracts from the Current Population Survey data maintained by Miriam King, Steven Ruggles, J. Trent Alexander, Sarah Flood, Katie Genadek, Matthew B. Schroeder, Brandon Trampe, and Rebecca Vick. Integrated Public Use Microdata Series, Current Population Survey: Version 3.0. [Machine-readable database]. Minneapolis: University of Minnesota, 2010. The sample for the District is small–therefore the post looks at a combined 15 year period.
Note: an earlier version of this post was published before the draft was completed.