

Like many other states and municipalities, the District sometimes earmarks or dedicates tax revenue for specific purposes rather than general budget purposes. One of the most common examples of a dedicated tax is the motor fuel tax used to fund roads and highways and it has become more popular as a way to raise tax revenue. On one hand, dedicating taxes guarantees funds are available for a particular purpose, such as making bond payments or matching federal grants. On the other hand, dedicating taxes to specific purposes reduces general funds available to support the full range of programs and services provided by government.
All or part of a tax may be dedicated to a specific purpose. For example, the Housing Production Trust Fund, which receives 15 percent of the revenue generated by the District’s deed recordation and deed transfer taxes while the sales tax on parking is fully dedicated to fund the District’s annual commitment to the Washington Metropolitan Area Transit Authority (WMATA).
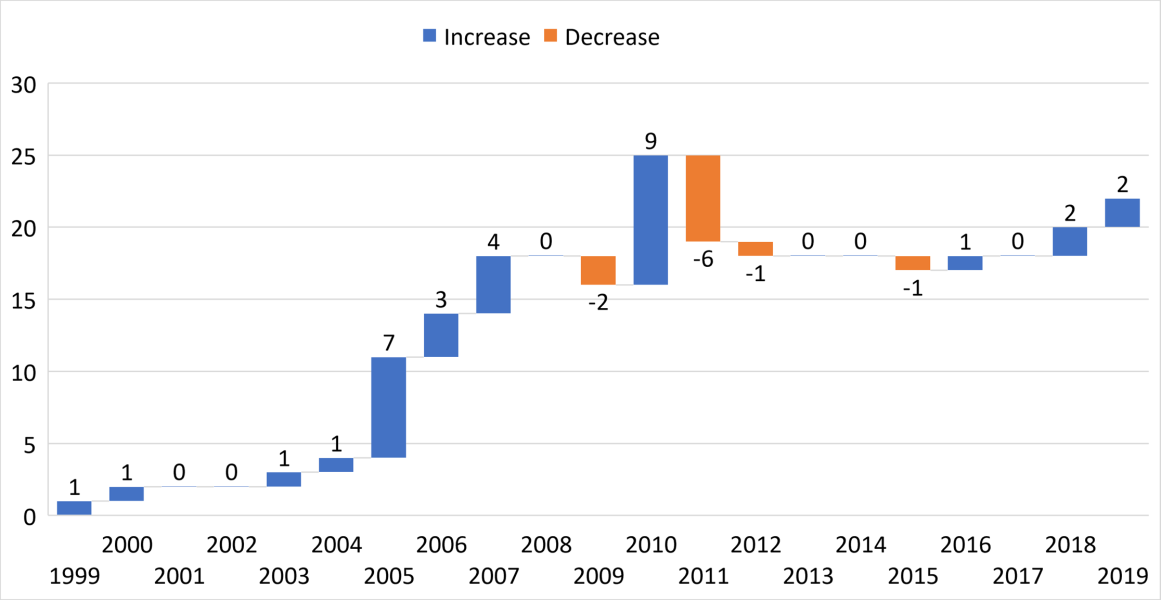
Dedicated taxes in the District were first reported in 1999. In that year, $51 million was dedicated to the Convention Center Fund from sales tax revenue associated with restaurant and hotel activity. The amount dedicated was 1.5 % of total gross revenue. Since FY 1999, the number of dedications from taxes has increased significantly. In FY 2019, there were 22 dedicated taxes (chart 1).
Chart 1: Change in number of dedications 1999-2019
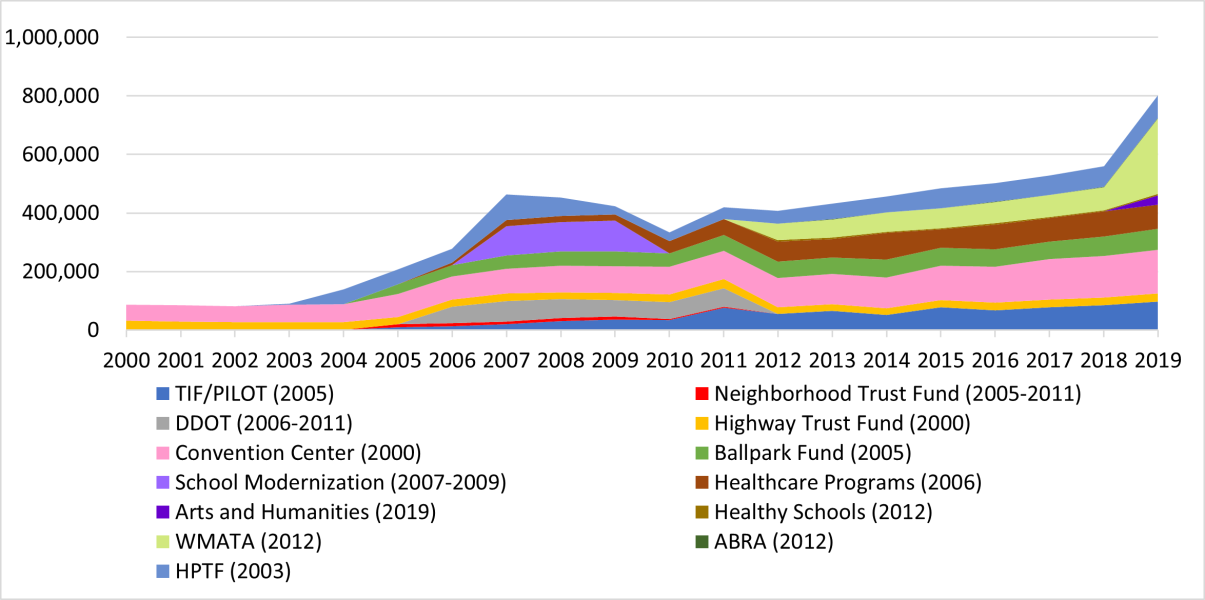
In addition to the increase in number of dedications, there has been substantial growth in the amount of tax revenue earmarked for dedications. During the period between FY 2010 and FY 2019, total dedicated taxes increased from $334 million in FY 2010, to $805 million in FY 2019, a 141 percent increase in the proportion of tax revenue set aside for specified purposes (Chart 2). The percentage of dedicated taxes to total taxes also increased from 7 percent of total taxes to 9.8 percent during the same period.
Chart 2: Aggregated dedications FY 2000 – FY 2019
Sales and use tax provided much of the revenue earmarked for dedications in FY 2010 and FY 2019, whereas the percentage of motor fuel, gross receipts, and property tax revenue as a total of dedicated taxes was reduced in FY 2019, compared to FY 2010 (Chart 3). The percentage increase in the proportion of dedications from sales and use tax revenue is due to 1) the number of new dedications (for example, a new dedication of $178.5 million for WMATA capital improvement projects representing most of the increase in FY 2019), and 2) changes in rates for some taxable items listed in Tables 1 and 2.
Chart 3: Dedicated tax by tax type as a percentage of total dedicated taxes
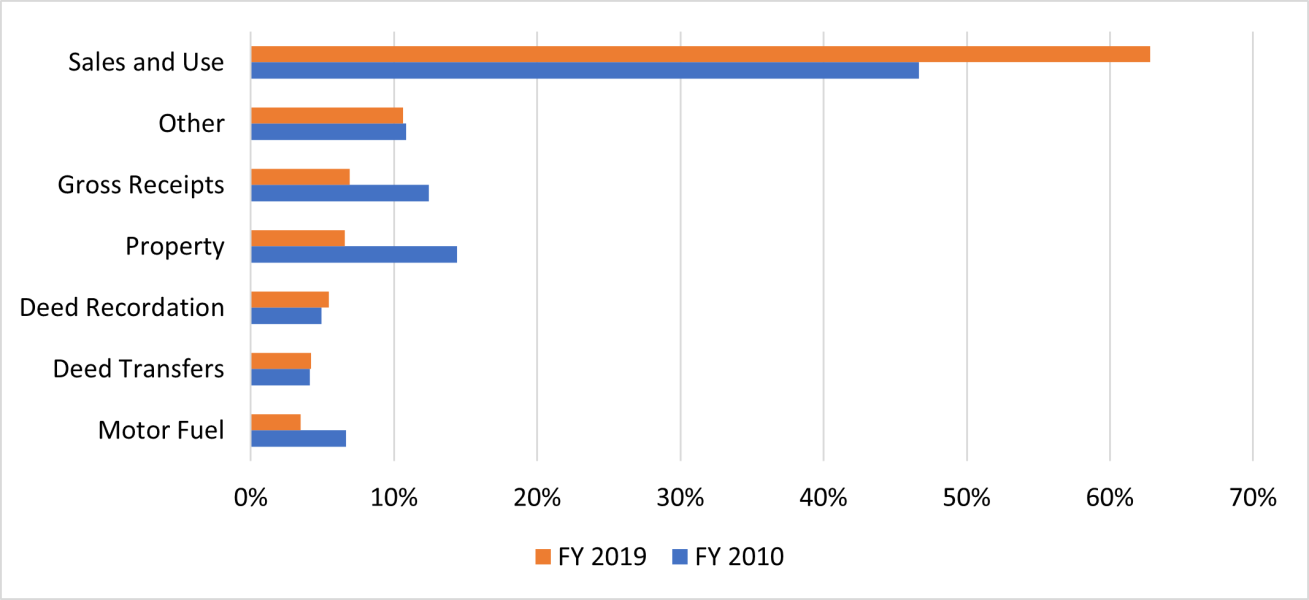
Note: Other includes dedications from health-related taxes and the Baseball Project.
Table 1: Changes in rates from sales and use tax, 2019 compared to 2010
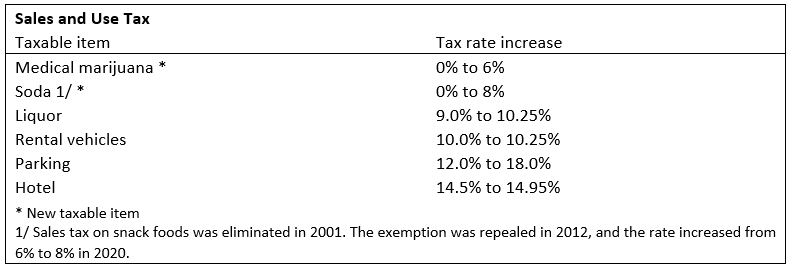
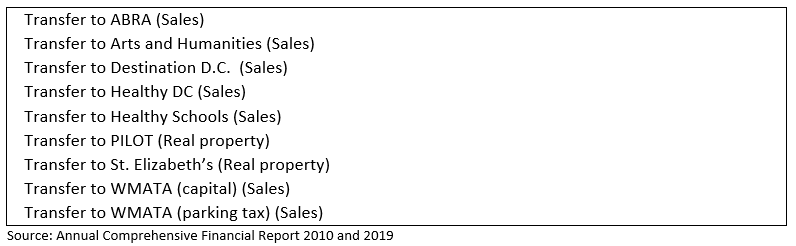
Table 2: New tax dedications by tax type, 2019 compared to 2010
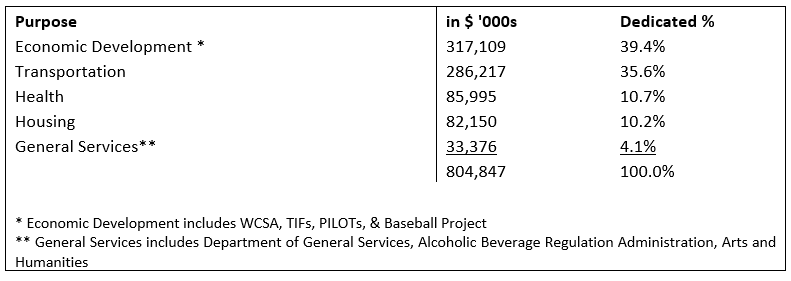
The District’s dedicated taxes are directed towards economic development, transportation, health, housing, and general services. In FY 2019, economic development projects and transportation accounted for 75 percent of dedicated taxes, shown in Table 3.
Table 3: Dedicated tax use categories, FY 2019
A summary of dedicated taxes is reported in the Annual Comprehensive Financial Report (ACFR), as is information on the District’s debt. In addition to the ACFR, the CFO’s Office of Revenue Analysis prepares a report on dedicated taxes every two years. In addition, dedicated tax revenue is estimated as part of the official quarterly revenue estimate and details about fund balance, revenue, and use are included in the revenue chapter of the annual budget summary. However, these reports focus on reporting the data and do not evaluate the effectiveness or the continuing need for dedications.