
A small number of “spoiler “units with high turnover may be the reason.
The District, along with a few other housing major markets in the nation, has rent control laws that were enacted to protect tenants against unreasonable rent increases. The laws governing rent control in these markets generally stipulate that rent increases are bound by the Consumer Price Index or other cost of living measures. These laws also allow for larger increases when units become vacant (we will return to this point later).
If rent increases are generally constrained by the cost of living, how could the median rent in the District over the 2005-2014 period have grown by 65 percent, or nearly 6 percent annually, when the DC consumer price index over the same period grew by only 30 percent, or just under 3 percent per year? In addition, as shown below, growth in median rents in DC has outpaced other markets where rent control laws are also in place.
| Place | 2005 | 2014 | Percent Change |
|---|---|---|---|
| District of Columbia | 768 | 1267 | 65.0% |
| Manhattan | 949 | 1461 | 54.0% |
| Brooklyn | 788 | 1136 | 44.2% |
| San Francisco | 1068 | 1538 | 44.0% |
| Los Angeles County | 852 | 1145 | 34.4% |
One possibility is that most units are not subject to rent control and must pay what the market will bear. To analyze this, we looked at data on the number of rental units subject to rent control in the District. Under DC laws most rental units with more than 5 units and built prior to 1975 are subject to rent control.
Here’s what we found in terms of the number of units subject to rent control:
| Rental Unit Type | Number |
|---|---|
| Total Rental Units | 140,778 |
| Subject to Rent Control | |
| Built Prior to 1975 | 70,964 |
| Other possible restrictions/control | 18,037 |
| Sub total | 89,001 |
| Excluded from rent control | |
| Less than 5 units | 32,370 |
| Built After 1975 | 19,407 |
This is what the data looks like by ward:
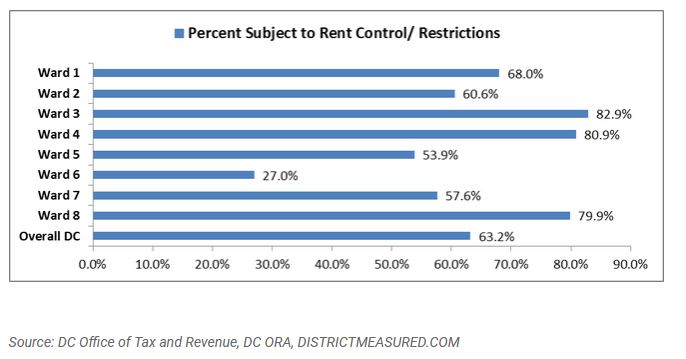
Highlights
- Almost two thirds of all rental units are potentially subject to rent control or other restrictions. This is a significant share of the entire rental stock.
- The highest concentration of rent control units was located in Wards 3 and 4 with over 80 percent of all units potentially subject to rent control.
- Wards 5, 6 and 7 had the lowest overall share of rent controlled units. In Ward 6, less than a third of all units are subject to rent control.
- These overall findings are largely consistent with the results of a prior study from the Urban Institute, “A Rent Control Report for the District of Columbia” by Peter A. Tatian, Ashley Williams, June 17, 2011 which can be accessed here.
To put these statistics further into perspective we looked at the share of rent regulated apartments in New York City.
This is what we found for New York City’s Boroughs:
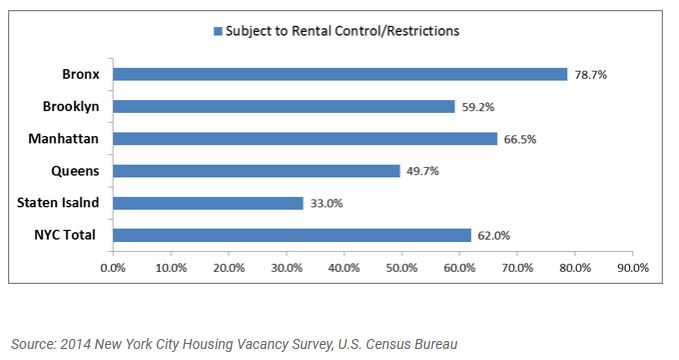
DC's overall share of rent regulated units is comparable to New York City’s, although certain DC Wards have an even higher share of regulated units than in the Bronx or Manhattan.
So what accounts for the large increases in rents given that two thirds of DC rental units are subject to rent control?
Two provisions of the law are likely to account for this:
When a DC tenant vacates a rental unit the amount of rent charged may, at the election of the housing provider, be increased:
(1) By 10% of the current allowable amount of rent charged for the vacant unit; or
(2) To the amount of rent charged for a substantially identical rental unit in the same housing accommodation; provided that the increase shall not exceed 30% of the current rent charged for the vacant unit.
It is easy to see how the combination of these two provisions can result in substantial price increases. This is what could happen to rents in a building where one unit (Unit 1) has a relatively high turnover. We assumed a turnover of once every three years for this unit, which is not unusual given DC’s high mobility. The other units have no or limited turnover. We assumed all comparable units started with a rent of $1,000 in 2004.
| Year | Unit 1 | Unit 2 | Unit 3 | Unit 4 |
|---|---|---|---|---|
| 2004 | $1,000 | $1,000 | $1,000 | $1,000 |
| 2005 | $1,100 | $1,020 | $1,020 | $1,020 |
| 2006 | $1,122 | $1,040 | $1,040 | $1,040 |
| 2007 | $1,144 | $1,061 | $1,061 | $1,061 |
| 2008 | $1,259 | $1,082 | $1,082 | $1,082 |
| 2009 | $1,284 | $1,284 | $1,104 | $1,104 |
| 2010 | $1,310 | $1,310 | $1,126 | $1,126 |
| 2011 | $1,441 | $1,336 | $1,149 | $1,149 |
| 2012 | $1,470 | $1,470 | $1,172 | $1,172 |
| 2013 | $1,499 | $1,499 | $1,195 | $1,195 |
| 2014 | $1,649 | $1,649 | $1,219 | $1,219 |
| 2015 | $1,682 | $1,682 | $1,585 | $1,243 |
| Percent Increase 2004-2015 | 68% | 68% | 58% | 24% |
Turnover in one “spoiler” unit can cause rents to increase for all comparable units in the building.
Even the third unit in this hypothetical building, which turns over only once in ten years, has seen its potential rent increase by 58 percent. Only the fourth unit, that has seen no turnover, has a rent that remains below $1500.
As shown above, given allowable vacancy increases and comparability under DC law, even one comparable unit with a high turnover can cause rents to increase substantially for many units. Higher turnover, which may be due to changing demographics (more married couples and fewer singles remaining in the same unit for many years) or a spoiler unit, which may be the substantially identical unit on the same floor but close to the garbage room or near the garage exit, could cause rents to increase significantly even with rent control.
What exactly is the data?
To determine units potentially subject to rent control we looked at the year built and number of units for the following building codes for rental properties (21, 22, 25, 28,216 and 217) from the DC Office of Tax and Revenue Real Property Tax Database. The New York City Housing and Vacancy Survey (NYCHVS), sponsored by the New York City Department of Housing Preservation and Development, is conducted every 3 years to comply with New York state and New York City’s rent regulation laws. The Census Bureau has conducted the survey for the City since 1965. The 2014 NYCHVS is the 16th such survey. No similar study exists for DC.
Bob Zuraski contributed to this post.