
Nearly 800,000 people work in the District of Columbia, yet only about 30 percent of the District’s workers live in the city-proper. Workers in low-wage jobs are more likely to live in the city than those in middle- and high-wage jobs. Thirty-nine percent of D.C.’s workers in low-wage jobs lived in the city between 2010 and 2014, compared to 30 percent in middle-wage jobs and 27 percent in high-wage jobs.
We define a job as low-wage if its median wage was in the bottom 25 percent of median wages across all jobs in D.C (or below $44,000). High-wage jobs have median wages in the top 25 percent (or above $86,000) and middle-wage jobs are in between.
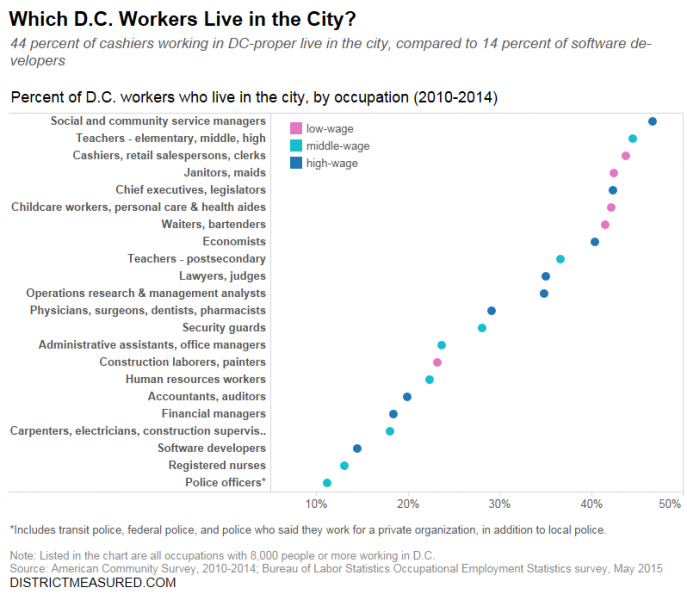
You can see how this plays out by occupation in the graph below. Cashiers, janitors, childcare workers and others in low-wage jobs are more likely to live in the city than most other workers, though people in a handful of middle- and high-wage occupations, like managers of social and community services, teachers, and chief executives, have relatively high rates of living in the city too. Registered nurses and police officers (which include transit and federal police) are the least likely to live in the city.
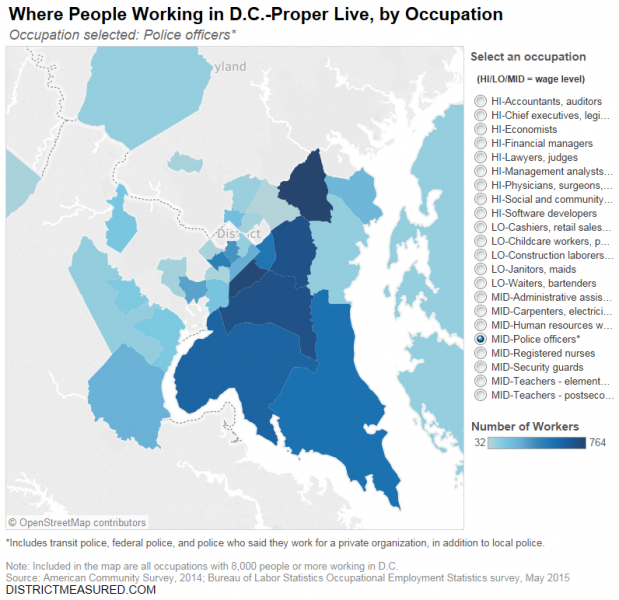
Here’s where these workers live:
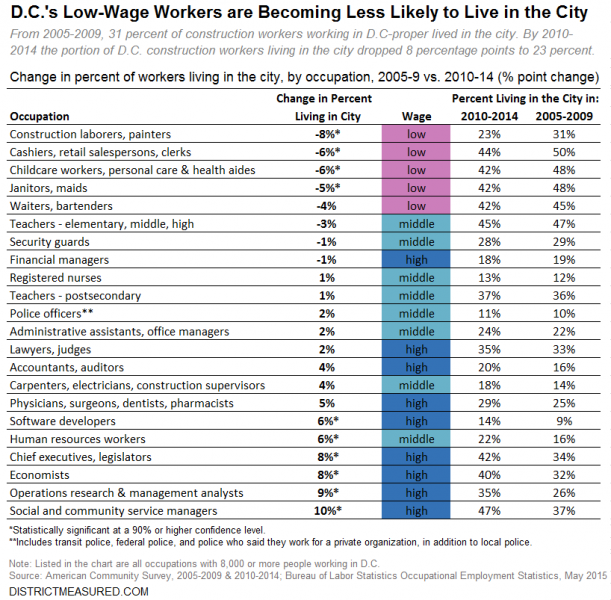
People in low-wage jobs tend to live in the city more than others, but that’s been changing over the past decade, as you can see in the chart below. The city is losing construction workers, cashiers, childcare workers, and janitors, and gaining people in high-wage jobs, like managers of social and community services, operations research and management analysts, and economists.
In less than a decade, the workers most likely to live in the city shifted from cashiers, retail salespersons and clerks (50 percent lived in the city in 2005-2009) to managers of social and community services (47 percent lived in 2010-2014).
Meanwhile, over the same time period, the least likely to live in the city switched from software developers (9 percent in 2005-2009) to police officers (11 percent in 2010-2104).
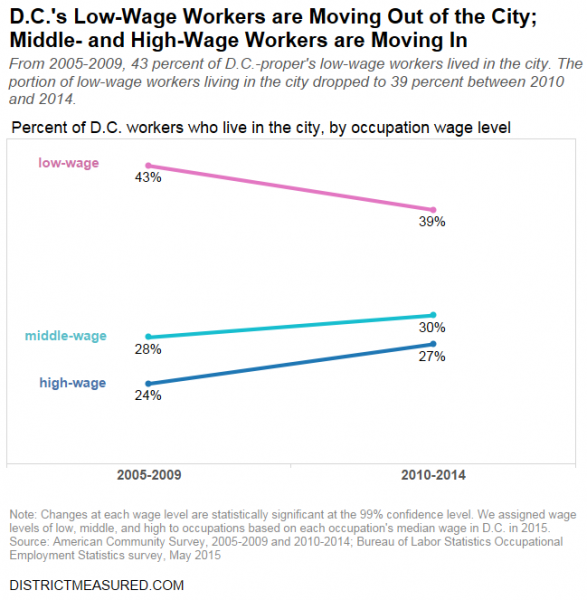
As the graph below shows, this is part of a larger pattern of D.C. workers in middle- and high-wage jobs starting to show a preference for living in the city, and workers in low-wage jobs increasingly living in the suburbs – a trend that’s unsurprising given the District’s increasing cost of housing. The percent of workers in low-wage jobs living in the city decreased from 43 percent to 39 percent between 2005-2009 and 2010-2014, while the percent of workers in high-wage jobs living in the city increased from 24 percent to 27 percent over the same time period. These changes may seem small, but they are statistically significant at the 99 percent confidence level.
What exactly is this data?
Wage data: Our wage data comes from the Bureau of Labor Statistics Occupational Employment Statistics survey of D.C. workers from May 2015. We define a job as low-wage if its annual median wage was in the bottom 25 percent of annual median wages across all jobs in D.C (or below $44,000). High-wage jobs have annual median wages in the top 25 percent (or above $86,000) and middle-wage jobs are in between.
Percent of Workers Living in the City: Our data comes from the American Community Survey PUMS data for 2005-2009 and 2010-2104. For our universe of D.C. workers we started with everyone living in D.C., Maryland, or Virginia who works in D.C., so we are excluding long-distance commuters who work in D.C. but live in places outside of D.C., Maryland, and Virginia. When we analyzed specific occupations, we looked at all occupations with 8,000 or more workers in D.C., with the exception of miscellaneous managers since the category is vague. We grouped some occupations together so they surpassed our 8,000 person threshold.
Map of Where Workers Live: This data comes from the American Community Survey PUMS data for 2014. We only look at workers who work in D.C. and live in either D.C., Maryland, and Virginia. All of the occupation groups in the map have 8,000 or more people working in the city.
Police Officers: Police officers in this case includes more than just people employed by the Metropolitan Police Department; it also includes transit police, federal police, and police who said they work for private organizations. In 2014, the Metropolitan Police Department released data showing 17 percent of its officers live in the District.
Errors: The data in this post have various margins of error since the data comes from surveys. In most cases we used a five-year data set to reduce the errors, and only looked at occupations with 8,000 people or more. The errors are highest for the map of where people live because for that we had to use a one-year dataset (geographic boundaries changed within the five-year dataset, making a map more difficult to produce). The map is intended to give readers a general sense of where people live; we discourage people from using it for direct area-to-area comparisons. Our findings on the loss and gain of workers of different occupations and wage levels are in many cases statistically significant and we have noted this in the post.