

When a city's commercial office buildings are experiencing a trend of increasing net vacant space over the long term, it signifies a growing lack of demand for office space in the market. This surplus of available office space can prompt a decline in property assessment values as the buildings produce less net income and are considered less sought-after assets. In this context, fewer investors/potential buyers may be less inclined to purchase these buildings, reducing sale prices for the few transactions that do occur. These buildings' overall market value diminishes with lower sale prices and decreased demand.
The following analysis illustrates how the recent trend of rapidly increasing levels of vacant office space in DC is impacting the value of several hundred large office buildings. The analysis identifies more than 500 high-value, large commercial office buildings in DC, and finds that at least 86 percent of them are expected to lose value at some point between 2020 and 2025. Among these buildings expected to lose value, we estimate a total loss of more than $12 billion in building value. The declining value of these buildings as well as decreased sales transactions are affecting commercial property and deed tax collections.
Shrinking Office Demand Drives Vacancy Rates Higher
One of the major problems plaguing the District of Columbia office market is the growing amount of vacant office space. Between 2020 and 2023, vacant office space increased by 8.4 million square feet (msf) or 46.2 percent. (Figure 1)
Figure 1
 |
||
|
Source: CoStar |
Initially, Class B office space experienced a faster increase in vacancy rates than Class A office space. However, due to the surge of remote work starting in 2020, new office leases across both sectors required, on average, 13 percent less space. Consequently, the total space demanded by all office tenants decreased by 5.2 million square feet (3.8 percent) between 2020 and 2023, the most significant decline in total space in the past two and a half decades (Figure 2).
Figure 2
 |
||
|
Source: CoStar |
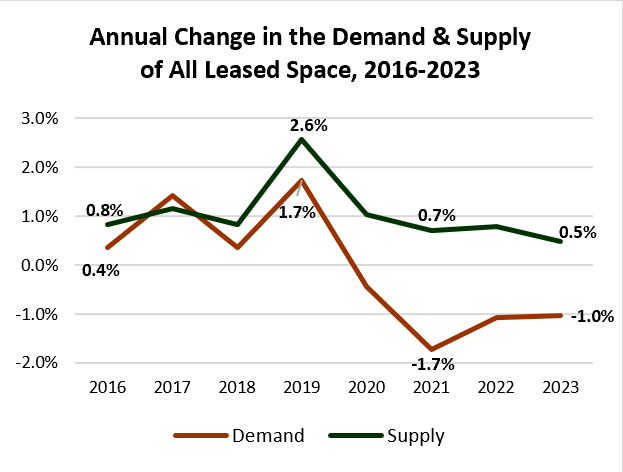
While the decreasing demand for space is a primary cause of the growing amount of excess office space in recent years, this issue has been further exacerbated by the continuous, albeit modest, expansion in the net supply of office space (Figure 3). This increase in supply from 2020 to 2023 has been exclusively in Class A properties, with Class B space decreasing over the same period. Consequently, the city's direct vacancy rate rose from 11.7 percent in 2020 to 15.6 percent in 2023.
Figure 3
 |
||
|
Source: CoStar |
The supply of office space is the total square footage of city office space in privately owned, existing, and fully constructed class A and B commercial office buildings that are leased, for lease, or for sale. The demand for office space is the total square footage of space for the same set of buildings that is under a lease obligation and physically occupied by a tenant.
The Primary Source for Declining Values
As vacancy rates in the District of Columbia office market have increased, another consequential trend has emerged: declining property values. This decrease is the result of various factors, including the notable increase in vacant office space.
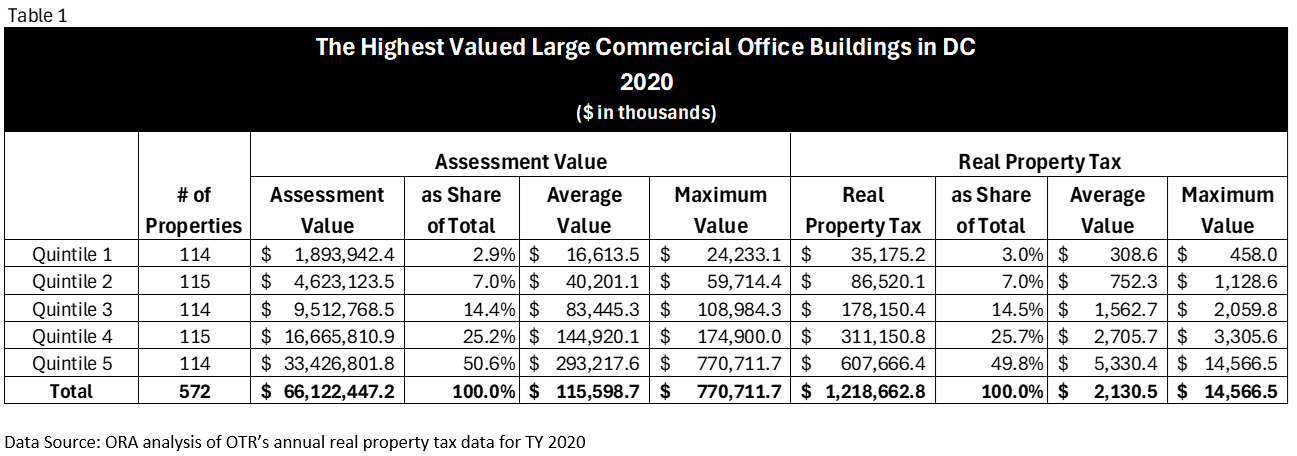
Table 1 shows the economic situation of all fully taxable office buildings with an assessment value of more than $10 million in 2020. Of the 572 office buildings, the top 20 percent highest valued buildings (114 buildings) accounted for half of the $66.1 billion in assessed value and $1.219 billion in total real property taxes paid by all that year.
However, by 2023, 85.3 percent of these buildings experienced a decrease in value, causing them to lose a total of $6.9 billion (11.9 percent) in value and pay $143.2 million less in real property taxes in 2023 (Table 2).

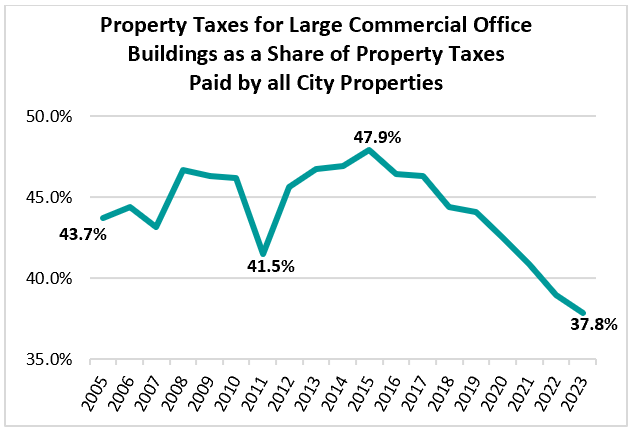
In Figure 4, you can see the real property taxes paid by large commercial office buildings with an assessment value of more than $10 million in 2020 (LCOBs) as a proportion of real property taxes paid by all properties in the District from 2005 to 2023. The percentage of taxes paid by LCOBs reached its peak in 2015 at 47.9 percent and has been steadily declining since then. In 2023, LCOBs only accounted for 37.8 percent of all property taxes paid to the District, as the assessed value of LCOBs grew by just 4.1 percent from 2015 to 2023, while residential property grew by 58 percent.
Figure 4
 |
||
|
Source: ORA analysis of OTR's annual real property tax data for TYs 2005-2023 |
Additionally, the steady decline illustrated in Figure 4 is expected to persist, with 492 (86.0 percent) of the city’s most valuable LCOBs projected to experience an additional 10.8 percent decrease in value between 2023 and 2025(Table 3). The FY 2025 assessment values are currently proposed assessments and have not yet been through the appeals process, meaning the final decrease between FY23 and FY25 could be higher than shown in Table 3. These assessment values come from our Real Property Tax Administration.
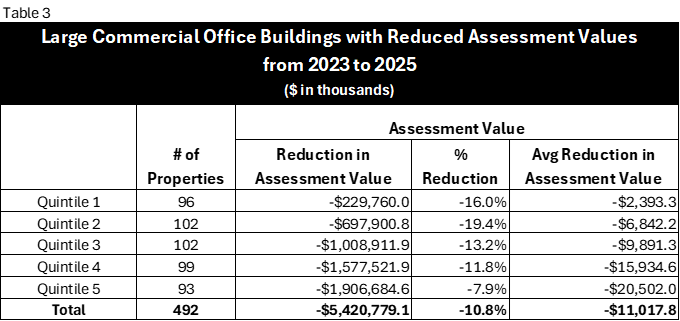
Source: ORA analysis of OTR's annual real property tax data for TYs 2023 and 2025
If we combine this projected loss in value with already realized losses, 86 percent or more of the city's highest-value LCOBs (large commercial office buildings) could lose a total value of $12.3 billion at some point between 2020 and 2025 due to a decrease in demand for leased space (as shown in Figure 5).
 |
||
|
Source: ORA analysis of OTR's annual real property tax data for TYs 2023 and 2025 |
Note that this loss does not account for buildings with increasing values during this time, which will offset some of this loss. When we look at the entire cohort of 572 high-value office buildings we identified, assessment records indicate their total value is expected to decline from $66.1 billion in 2020 to $55.9 billion in 2025. This represents a loss of $10.2 billion, or 15.4% of their total value. The 2025 assessment values are subject to appeal and could drop further.
Decreased Interest in Buying DC Office Buildings and the Impact on the Deed Tax
The difficult market conditions appear to be contributing to a decline in investor confidence, prompting property investors and potential buyers to hesitate or even abandon their pursuit of owning city office buildings. Consequently, the diminishing interest in purchasing office properties more ostensibly reflects the challenges confronting the city's commercial real estate sector.
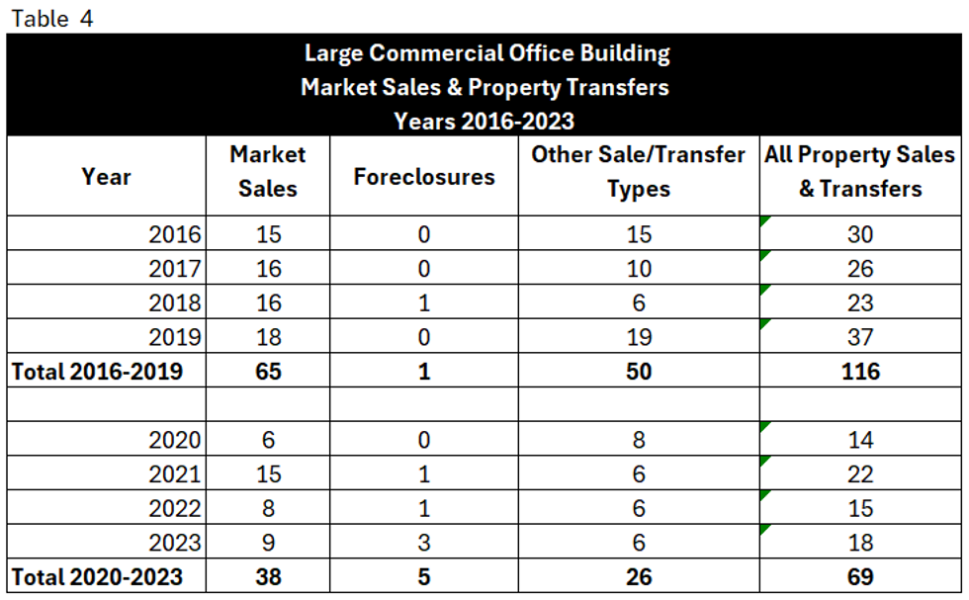
Table 4 shows that from 2020 to 2023, there have been fewer market sales and more foreclosures than in the previous four years. (Six of the market sales in 2020 to 2023, entailed converting office buildings to primarily residential use.)
 |
||
|
Source: ORA analysis of OTR's annual real property tax data for TYs 2016 to 2023 |
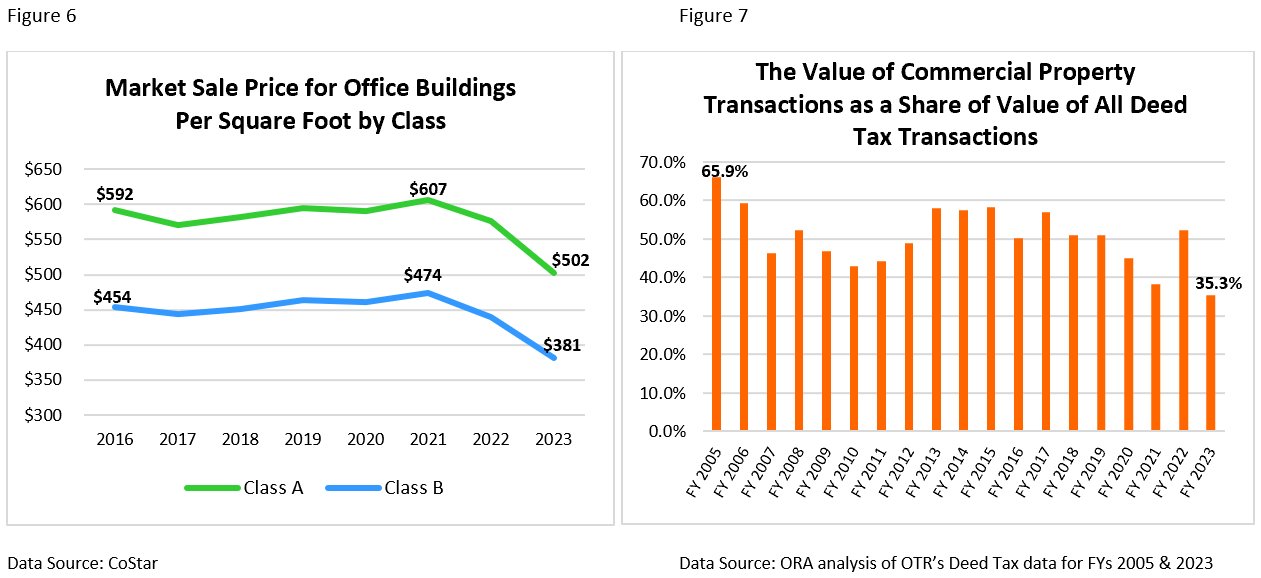
Between 2021 and 2023, the average sales price per square foot for commercial buildings declined by 17.3 percent for Class A office buildings and 19.6 percent for Class B buildings (Figure 6). The decline in the number of sales and prices of commercial buildings explains the halving in commercial deed tax collections (as a share) between 2005 and 2023 (Figure 7).
Impact on Building Values in the Medium-Term
Between 2012 and 2023, unoccupied office space in the District of Columbia more than doubled from 11.7 to 26.5 million square feet. As a result, the direct vacancy rate increased from 9.3 to 15.6 percent. Since 2020, the demand for office space has decreased due to the rise of remote work, and this trend is expected to continue over the next three years. According to CoStar, the amount of empty office space in the city is projected to increase by an additional 11.8 million square feet (equivalent to 44.5 percent) by 2027. But while falling average office rents per square foot and rising market cap rates are also adversely affecting office property assessments, the predominant factor is the increase in vacancy rates. These trends are expected to result in continued lower annual assessment values for hundreds of office buildings until at least 2027.
 |
||
What is this data?
This study used administrative real property tax data from the Office of Tax and Revenue as well as commercial real estate market data from CoStar between the years of 2005 and 2023. CoStar Group, Inc. is a company that provides information, analytics, and marketing services to the commercial property industry both in the United States and abroad.