
The District of Columbia’s home sale market has experienced dramatic changes in recent years. There were 1,806 (20 percent) more homes sold in the District in 2021 than in 2018, partly due to the 30-year mortgage rate being cut by one-third to 2.96 percent over the same period. Conversely, there were 3,954 (36.6 percent) fewer homes sold in 2023 than in 2021, largely due to the average mortgage rate more than doubling over the same period (Figure 1). Amidst such striking changes, this analysis uses Home Mortgage Disclosure Act data (HMDA data) to explore the role women homebuyers and mortgage applicants played in the shifting market over the six years.
Figure 1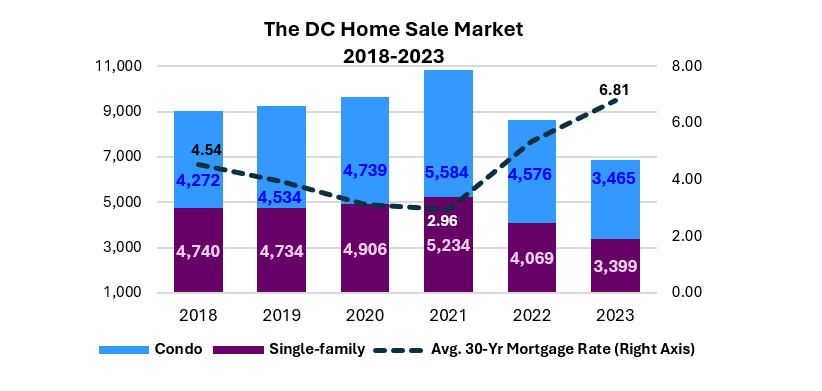
Data sources: Bright MLS, Federal Reserve Economic Data (FRED)
About 80 percent of single-family homes and condo units purchased as primary residences in the District are financed through mortgages by individual buyers. In the HMDA database, each mortgage record lists the applicant's sex as "male" or "female" for single applicants and as "joint" when two applicants are involved. Approximately 66 percent of all mortgages in the District are taken out by single homebuyers, with single women accounting for the largest share in 2023 (Figure 2). (A post earlier this year showed that most new homeowners via the DC Home Purchase Assistance Program (HPAP) tend to be single women.) However, single women homebuyers, on average, have the lowest incomes when buying homes compared to the other two groups (Figure 3).
Figure 2 & Figure 3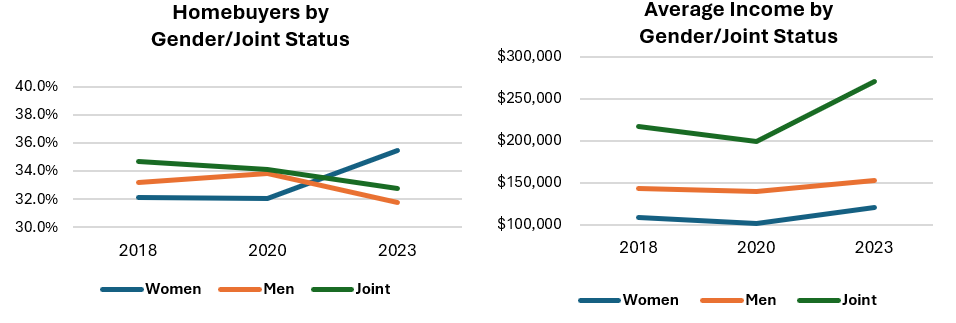
Considering DC’s high-cost housing market, why were women, who tend to have relatively lower incomes at the time of purchase, the most active in the homebuying market in 2023? One answer is that women are generally very active at the low end of the homebuying price spectrum in the city (Figure 4).
Figure 4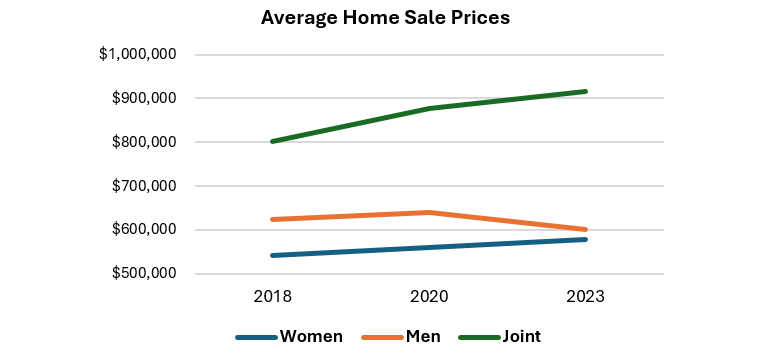 Our study merges the HMDA home purchase data with the District’s real property tax database based on purchase year, census tract, and home sale price. Using the resulting dataset, we find that most mortgages (64 percent) are for single-family structures and the remainder are for condo units (36 percent) (Figure 5).
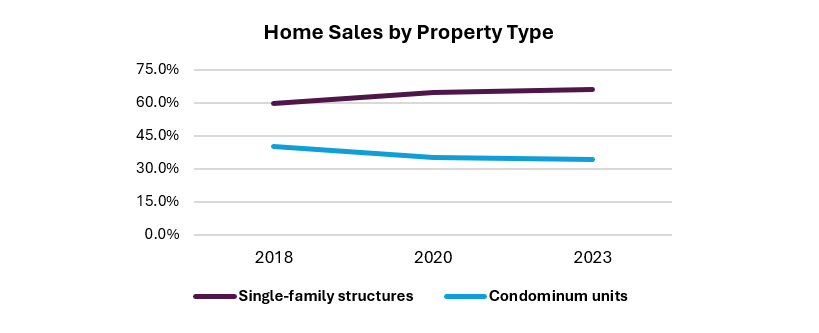
Data sources: HMDA, Office of Tax & Revenue Real Property Tax Base 2018, 2020 & 2023
Figures 6-9 also show that single women homebuyers tend to buy the most affordable homes in the city, which are often condos.
Figure 6 & Figure 7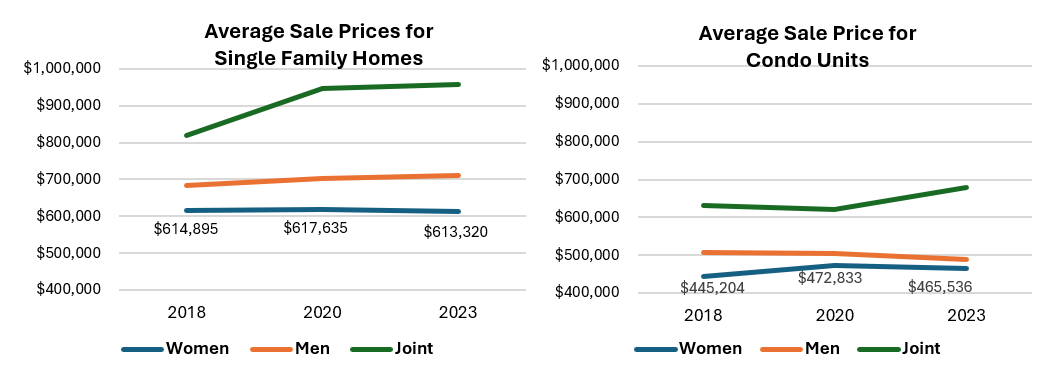 Figure 8 & Figure 9
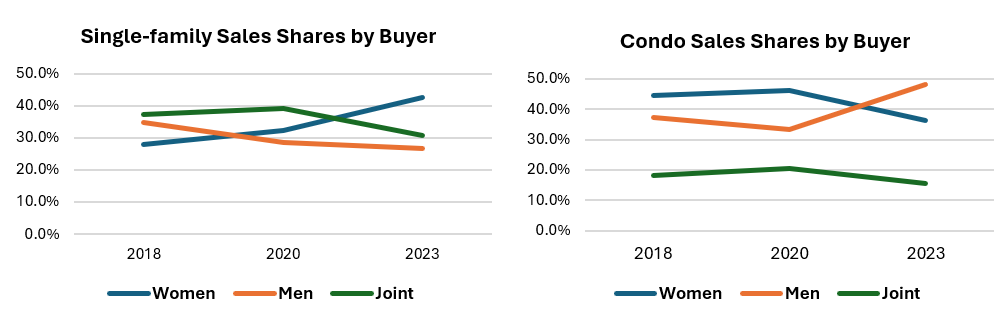
Despite mortgage interest rates peaking in 2023, Figure 8 shows that women purchased more single-family homes than men and joint buyers during the year. Meanwhile, Figure 9 indicates a shift where men increasingly bought condos, breaking with earlier trends. This pattern might indicate men opted for less expensive housing options, like condos, to offset the impact of higher borrowing costs.
As mortgage interest rates declined in 2020, 1,163 (16 percent) more mortgages were used to buy homes in 2020 than in 2018 (Figure 10). However, because interest rates began climbing in 2021, 3,534 (41.8 percent) fewer mortgages were used in 2023 than in 2020. With the number of mortgages between years 2020 and 2023 declining 966, 1299, and 1269 for women, men, and joint respectively, Figure 11 shows that women homebuyers appear to be the least responsive to interest rate hikes in 2023. So with women continuing to buy the most affordable homes and with men and joint buyers apparently being more impacted by the peaking of mortage interest rates, women in 2023 outnumbered both men and joint buyers in securing new mortgages despite having lower average incomes.
Figure 10 & Figure 11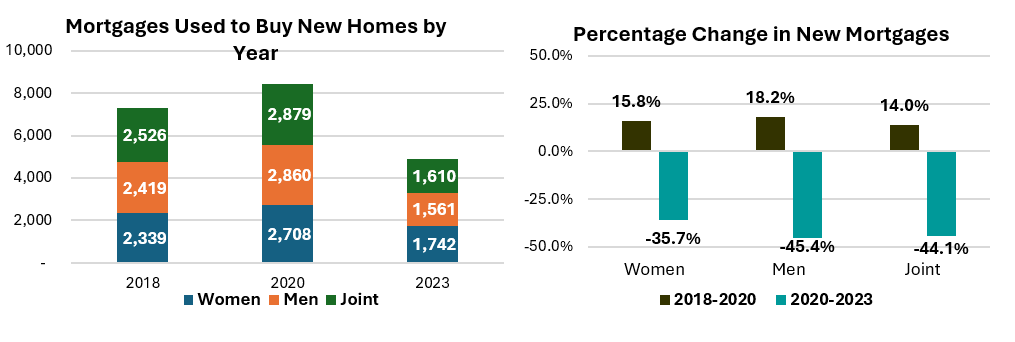
Conclusion
Even though women homebuyers tend to have the least income at the time of home purchase (generally between $100,000 and $121,000), they were the largest group that purchased homes in 2023. This likely stems from DC women home buyers consistently purchasing condos under $500,000 and single-family homes for around $600,000 and from them appearing to be the least affected by the doubling of mortgage rates in recent years.
What is this data?
The Home Mortgage Disclosure Act was enacted in 1975 and required financial institutions to disclose information about mortgages publicly. It is the most comprehensive source of information on the mortgage market and is used by a variety of entities, including regulators, consumer groups, and industry. The data's purpose is to provide market transparency and ensure institutions comply with fair lending laws. The annual data includes mortgage loan, property, and lender information for each mortgage loan in each state (and census tract) and information on each mortgage loan applicant, such as gender, race, and income.
Other data used: Office of Tax & Revenue Real Property Tax Base 2018, 2020 & 2023, Bright MLS home sale data for the District of Columbia, and Federal Reserve Economic Data (FRED).