
Achieving homeownership has always been a challenge for young working adults, but in recent years, the economic barriers have become even more daunting. Nevertheless, homeownership remains a quintessential aspect of the American dream, and many young households are determined to find ways to achieve this goal. They understand that owning a home can significantly contribute to their long-term financial stability and wealth accumulation.
The District government uses several home purchase programs to make homeownership attainable for low- and moderate-income residents. To understand who uses these programs, this report analyzes program participation data from the Department of Housing and Community Development for the Employer-Assisted Housing Program (EAHP), Home Purchase Assistance Program (HPAP), and the Inclusionary Zoning Program (IZ).
The main findings include:
-
Over 1,700 low- and moderate-income households became homeowners through the three home purchase programs between 2015 and 2021.
-
HPAP participants from 2016 to 2021 were approximately 71 percent Black, 68 percent female, 62 percent single-income tax filers with no dependents, and had a median age of 33 years.
-
Migration data of HPAP participants show the majority moved to a different ward when moving into their new home. Areas in the northern and eastern half of the city (wards 4-8) were the most popular destinations.
Background
The benefits of homeownership: building financial security and accumulating wealth
Homeownership contributes to household financial security and wealth accumulation in several ways. First, as homeowners pay off their mortgage, the equity in their home increases, and appreciation adds to their net worth. Second, homeowners can deduct certain housing expenses, such as mortgage interest and property taxes from their income taxes each year, which can amount to thousands of dollars in savings. Third, the growing amount of home equity can provide low-cost funding via a home equity loan or a home equity line of credit (HELOC) to fund large expenses such as a major home renovation, home expansion, children's college education, or even a business venture. Fourth, Homeownership protects homeowners from yearly rent increases. Homeowners with a 30-year fixed mortgage enjoy stable housing costs, unlike renters who face annual rent increases. This fixed monthly payment buffers homeowners from the effects of economic fluctuations and inflation. Long-term financial stability, in turn, enables homeowners to plan and budget more effectively, potentially freeing up resources for savings and investments and contributing to wealth accumulation.
In 2021, the median wealth of homeowners in the U.S. was approximately 44 times higher than that of renters, with 61.9 percent of households owning their own home. Home equity ranked second highest among homeowners' assets, with a median value of $174,000, closely following rental property equity. Furthermore, 79.5 percent of those aged 65 and older owned their home in 2022 compared to 39 percent of those under the age of 35.
Housing market challenges facing middle and low-income households
The cost of housing for middle- and low-income households has been increasing for many years. The Federal Reserve began raising interest rates in March 2022, which caused mortgage rates to climb to almost 8 percent in 2023, a level not seen in nearly two decades. This has made it harder for new middle- and low-income homebuyers to enter the market. As mortgage rates decrease in 2024 we expect to see more homes becoming available for sale. However, even with the anticipated decrease in interest rates after the highs of 2023, high home prices remain a significant obstacle for many potential first-time homebuyers.
Challenges and responses of young homebuyers to the housing affordability crisis
The median age for those purchasing their first home has risen from 29 in 1981 to 36 in 2023. One reason for this is the difficulty young renters face in saving for a down payment. According to a National Association of Realtors survey of prospective homebuyers, high rents, credit card debt, and student loan payments are the top three impediments for many prospective home buyers in saving for a sufficient down payment. Homebuyers who are unable to purchase their first home before their late 30s lose the opportunity to build wealth over a longer duration through the compounding effects of steady mortgage repayment and property appreciation.
The high cost of purchasing a home force many potential young homebuyers to rent for longer periods of time. Some even end up living well into their 30s with relatives who offer free or discounted rent. Others rely on substantial financial support from their families or inheritances to be able to afford their own homes.
Home purchase programs for low- and moderate-income buyers in Washington D.C.
In response to the rising cost of homeownership, District officials have implemented several programs to aid low- and moderate-income first-time homebuyers. Below are three of the major ones:
Employer-Assisted Housing Program (EAHP)
The EAHP offers eligible District government employees a deferred, no-interest loan up to $30,000 and a matching funds grant up to $20,000 for down payment and closing costs to purchase their first single-family home.
Home Purchase Assistance Program (HPAP)
The HPAP offers low-income eligible homebuyers a deferred, no-interest loan up to $202,000 and a matching funds grant up to $4,000 for down payment and closing costs to purchase their first single-family home. Prior to Fiscal Year 2023 the maximum loan amount for HPAP was $80,000.
Inclusionary Zoning Program (IZ)
A homeownership component of the IZ program offers eligible low-income homebuyers the opportunity to buy newly constructed homes in new single-family developments through a lottery program. The homes offered through this program ensure that housing costs do not exceed 41% of the owners’ annual income and the maximum home purchase price in 2024 is $408,900.
District home purchase programs: Participation and demographics
Using administrative data from the DC Department of Housing and Community Development (DHCD), we analyzed the participation and demographics of the District home purchase programs. Table 1 shows that between 2015 and 2021 over 1,700 low- and moderate-income households have become homeowners through the three housing programs. Of the programs reviewed here, HPAP produced the largest number (52.2 percent) of new homeowners (Table 2). Our study also revealed that participants often use more than one District housing program. Although our access to DHCD administrative data was limited, we identified 384 households (22.5 percent) that used a combination of the EAHP and the HPAP programs. Further, the annual reports for the IZ program indicate that for the years 2018 to 2021, between 15 and 21 new IZ homeowners used one or more of the other District home purchase programs (i.e., EAHP, HPAP, DC Open Doors, Operation Hope) to obtain become homeowners.
Table 1
| EAHP | HPAP | EAHP & HPAP | IZ | Total New Homeowners | |||||
|---|---|---|---|---|---|---|---|---|---|
| Number | Avg Purchase Price | Number | Avg Purchase Price | Number | Avg Purchase Price | Number | Avg Purchase Price | Number | |
| FY 2015 | na | na | na | na | na | na | 11 | $178,150 | 11 |
| FY 2016 | 15 | $371,008 | 136 | $250,324 | 76 | $301,722 | 33 | $190,511 | 260 |
| FY 2017 | 16 | $380,002 | 205 | $274,316 | 81 | $304,955 | 69 | $200,756 | 371 |
| FY 2018 | 38 | $390,331 | 102 | $300,313 | 104 | $328,164 | 37 | $188,681 | 281 |
| FY 2019 | 62 | $448,622 | 230 | $318,158 | 123 | $351,654 | 33 | $227,488 | 448 |
| FY 2020 | na | na | 166 | $340,087 | na | na | 40 | $241,602 | 206 |
| FY 2021 | na | na | 52 | $362,849 | na | na | 77 | $223,567 | 129 |
| Total | 131 | 891 | 384 | 300 | 1706 | ||||
Table 2 shows that new IZ homeowners primarily purchased condominiums, while new EAHP homeowners primarily purchased single-family dwellings. Over the study period, new HPAP homeowner purchases were evenly split between condos and single-family dwellings.
Table 2
| Property Type | EAHP | HPAP | EAHP & HPAP | IZ |
|---|---|---|---|---|
| Condominium | 33.0% | 50.4% | 24.6% | 89.2% |
| Single-Family (Row House) | 26.2% | 22.6% | 28.5% | 10.8% |
| Single-Family (Detached) | 15.5% | 6.8% | 10.8% | - |
| Single-Family (Semi-Detached) | 25.2% | 20.2% | 36.2% | - |
| Total | 100.0% | 100.0% | 100.0% | 100.0% |
Demographics of HPAP Participants
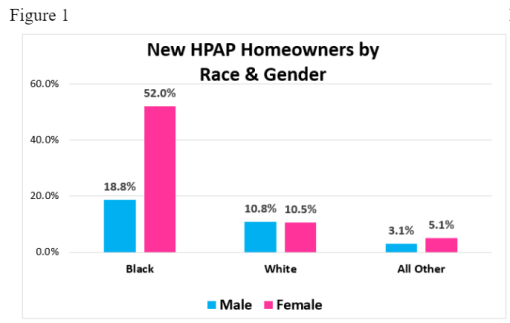
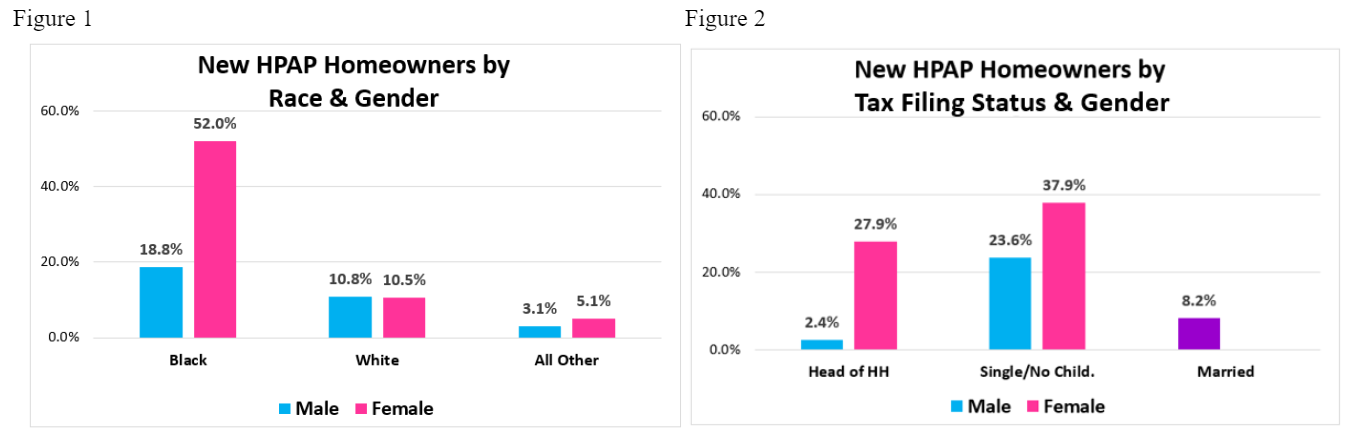
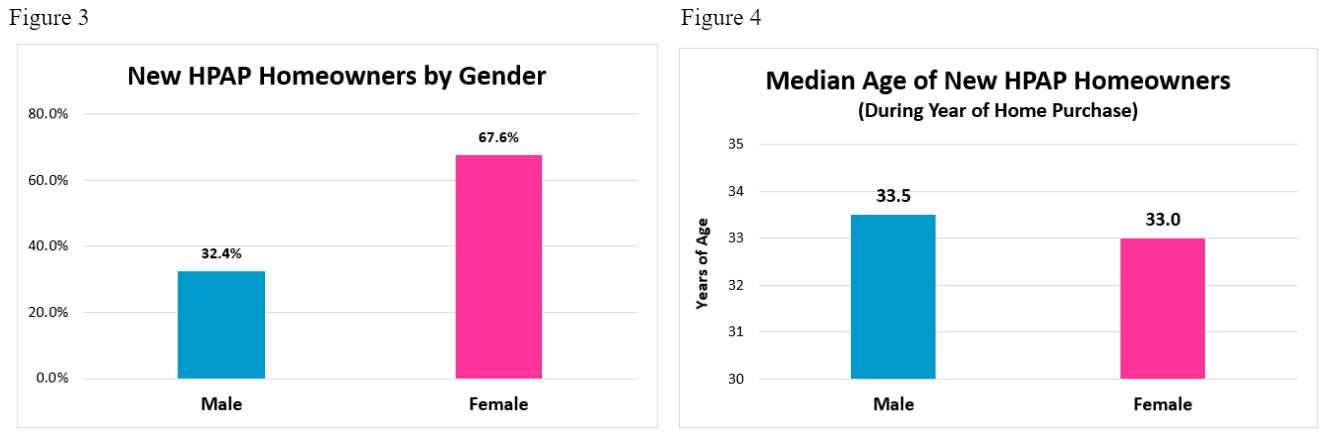
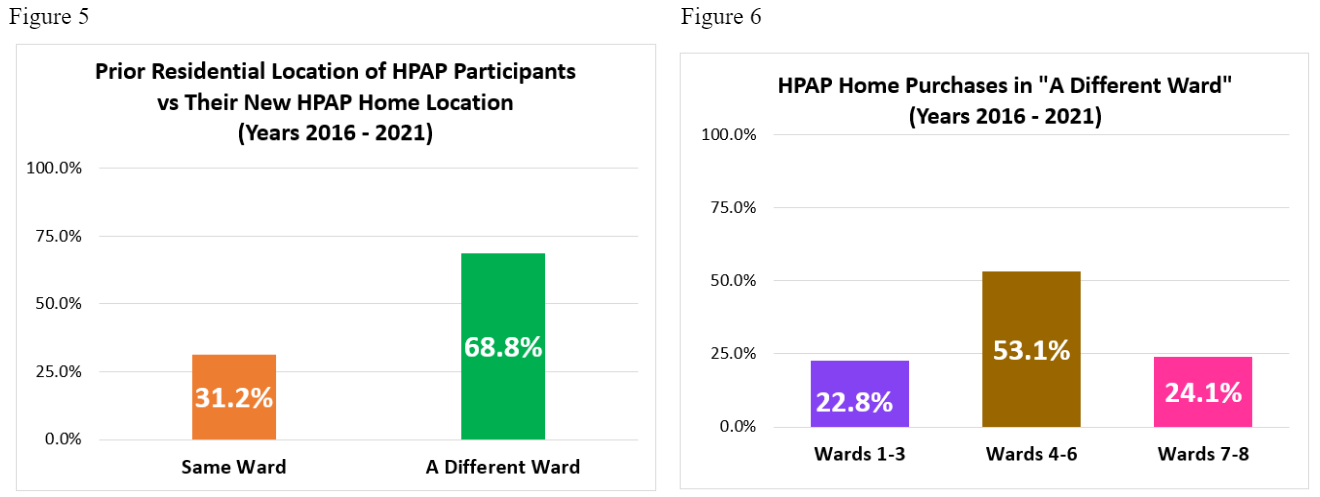
Figures 1-4, below, illustrate how these programs reduce barriers to homeownership for low- and moderate-income households across a wide demographic. According to HPAP data from 2016-2021, 70.7 percent of HPAP homeowners were Black, 61.5 percent were single-income tax filers with no dependents, 67.6 percent of the owners were female, and the median age of participants during the year of the home purchase was 33 years old.
The median age of 33 is noteworthy because it is slightly less than the national median of 36. This suggests that these programs may have expedited the path to home ownership for some individuals.
By comparing the wards of new HPAP home purchases made between 2016 and 2021 to the wards where new HPAP homeowners previously resided before their purchase, we gain valuable insights into migration patterns within the District for participants in the programs. First, 31.2 percent of new HPAP owners purchased their new home in the same ward as their previous residence, while 68.8 percent purchased in a different ward (Figure 5). Second, when home purchasers chose a different ward (68.8 percent of the time), it was in the northern and eastern half of the city (wards 4 to 8) 77.2 percent of the time (Figure 6). This percentage of movers purchasing in wards 4-8 is disproportionately high compared to the share of the city’s housing units found in these wards. Third, of those who purchased their new homes in the same ward, 65.5 percent of them resided in wards 7 and 8. Lastly, of the few participants who originally hailed from wards 1, 2, and 3, 80.2 percent purchased a home in wards 4 to 8, suggesting a flight from the highest-cost areas of the city to more affordable areas.
Trends in Home Value Appreciation
The District’s average home sale price was $841,000 in 2021, but the average HPAP home sale price was 56.9 percent lower at $362,849. From the investment perspective, low-income homeowners buying some of the most affordable homes in the most affordable areas of the city may be a wise investment decision. Residential properties with lower values in DC have consistently demonstrated some of the highest property appreciation rates over the past two decades. Homeownership in general has proven to be a wise investment in the District over the past decade. Figure 7 shows that the average annual growth rate in home value appreciation for homestead single-family dwellings and homestead condominiums in wards 4-8 from 2014 to 2023 outpaced the average annual growth in the Washington area consumer price index (of 2.4 percent) over the same time period.
With 77 percent of recent HPAP home purchases concentrated in wards 4 – 8, HPAP homes may also experience robust home value appreciation.
Figure 7
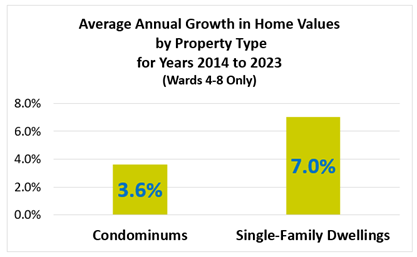
For example, if a single-family HPAP home also achieved a 7 percent average annual rate of appreciation, it would double in value in about 11 years. Similarly, a condo HPAP home, if subject to a 3.6 percent average annual rate of appreciation, could also see its value double, albeit over a longer period of about 20 years. Thus, even the lower-valued HPAP homes in the DC residential market may be poised to be rewarding long-term investments, providing homeowners the possibility of doubling their property values before their mortgage loans are fully paid.
While the programs like HPAP analyzed in this report serve a relatively small portion of residents (an average of over 200 per year), they have, over the past few decades, provided thousands with wealth-building opportunities and the ability to attain homeownership in the District.
What exactly is this data?
This analysis is based on administrative data from the DC Department of Housing and Community Development (DHCD) for the EAHP, HPAP, and IZ housing programs. The Office of Revenue Analysis analyzed the housing program data made available for years 2015 to 2021. DHCD data on new homebuyers was cross-referenced with DC real property records to identify property types for the homes purchased and cross-referenced with DC individual income tax return records to obtain the income tax filing status. Real property tax data for all homestead properties in wards 4-8 from 2014 to 2023 was also examined to ascertain the annual property growth rates of homestead properties.