
Around 829,000 people work in D.C. (within the city-proper), and about 26 percent of them are immigrants. Today, the Washington Post reports that some of D.C.’s immigrant workers, particularly those working in restaurants and some daycare centers and schools, are going on strike.
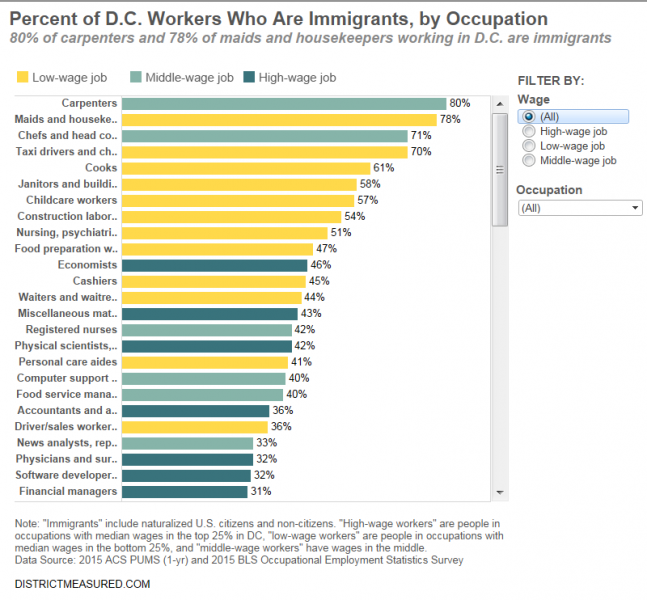
Indeed, the industries with people on strike have some of the highest concentrations of immigrants in D.C., as you can see in the graph below. Seventy-one percent of chefs and head cooks working in D.C. (within the city-proper) are immigrants, as are 61 percent of lower-rank cooks. Fifty-seven percent of childcare workers in D.C. are immigrants. The occupation in D.C. with the largest concentration of immigrants is carpenters, 80 percent of whom are immigrants. (In our analysis we only looked at occupations with more than 3,000 workers in D.C.)
Most of the occupations with the highest concentrations of immigrants in D.C. are those with low or middle wages. However, immigrants comprise almost half of D.C. workers in several high-wage occupations: economists (46 percent), mathematicians and statisticians (43 percent), and physical scientists (42 percent).
We define a job as low-wage if its median wage was in the bottom 25 percent of median wages across all jobs in D.C (or below $44,000). High-wage jobs have median wages in the top 25 percent (or above $86,000) and middle-wage jobs are in between.
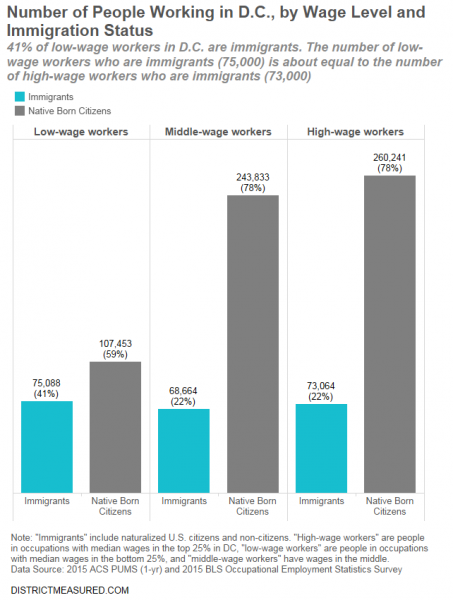
While low-wage jobs in D.C. have the highest concentration of immigrants (41 percent of all low-wage workers in D.C. are immigrants, compared to 22% of middle- and high-wage workers), the number of immigrants in low-wage jobs in the city is roughly equal to the number of immigrants in high-wage jobs, since the city has many more high-wage workers. There are about 75,000 immigrants in low-wage jobs in D.C. and about 73,000 immigrants in high-wage jobs.
What exactly is this data?
Our data on immigrants by occupation comes from the 2015 American Community Survey 1-year PUMS data. “Immigrants” include naturalized U.S. citizens and non-citizens. “D.C. workers” are people who live in D.C., Maryland, and Virginia who report D.C. as their place of work. We only look at occupations with more than 3,000 people working in D.C. in order to reduce sampling errors. Because the ACS is based on a sample, there is a margin of error in all of our calculations. Our calculations should be treated as estimates, not precise counts.
Our wage data comes from the May 2015 Bureau of Labor Statistics Occupational Employment Statistics Survey. We define a job as low-wage if its median wage was in the bottom 25 percent of median wages across all jobs in D.C (or below $44,000). High-wage jobs have median wages in the top 25 percent (or above $86,000) and middle-wage jobs are in between. In cases where the occupation code in the ACS data did not match the occupation code in the BLS data, we calculated a median wage using the ACS data.