Sorry, you need to enable JavaScript to visit this website.

ora-cfo

ORA CFO
DC.Gov Home
 

DC Taxes, Visualized

Thursday, October 31, 2024 - 8:15am

Note: This post is optimized for Desktop viewing.

We recently released our biennial graphic guide to DC’s tax system. It has over 50 graphics illustrating the ins and outs of DC taxes—including property, sales, income taxes, and more. You can read the full guide here or see some snippets of our favorite graphs below. The guide explains…

…The sources of our city revenue

Overview of DC Local Revenue (FY 2023)

Pie chart showing the composition of DC revenue sources. Income Tax is the largest segment at 36.1%, followed by Property Tax at 25.7%, Sales and Excise Tax at 17.4%, Non-Tax Revenue at 13.5%, Other Taxes at 3.8%, and Gross Receipts Tax at 3.5%.

…How different taxes work

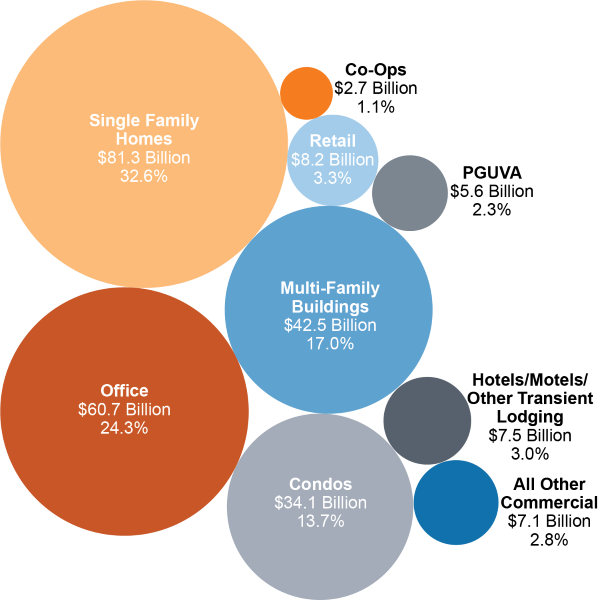
Which Properties are Taxable? (January 2024)

Table showing D.C. Real Property Classifications with their nominal tax rates per $100 of assessed value. Class 1 (residential): $0.85. Class 2 (commercial): $1.65 if assessed value is not greater than $5 million; $1.77 if greater than $5 million but not greater than $10 million; $1.89 if greater than $10 million. Class 3 (vacant or unimproved land): $5.00. Class 4 (blighted): $10.00.

Bubble chart showing the taxable assessed value of DC real property by property type. Single Family Homes is the largest category at $81.3 billion (32.6%), followed by Office at $60.7 billion (24.3%), Multi-Family Buildings at $42.5 billion (17.0%), Condos at $34.1 billion (13.7%), Retail at $8.2 billion (3.3%), Hotels/Motels/Other Transient Lodging at $7.5 billion (3.0%), All Other Commercial at $7.1 billion (2.8%), PGUVA at $5.6 billion (2.3%), and Co-Ops at $2.7 billion (1.1%).

…Who pays what

Individual Income Tax Liability Concentrated Among Earners Over $100k (TY 2022)

Side-by-side horizontal bar charts showing DC individual income tax statistics by income bracket across three panels: Share of Tax Returns, Share of Adjusted Gross Income, and Share of Tax Liability. Income brackets range from $0–$20K to $1M and Over. The $50K–$100K bracket has the largest share of returns at 26.6%. The $1M and Over bracket, while representing only 0.8% of returns, accounts for 20.9% of adjusted gross income and 25.6% of tax liability — the highest share in both categories.

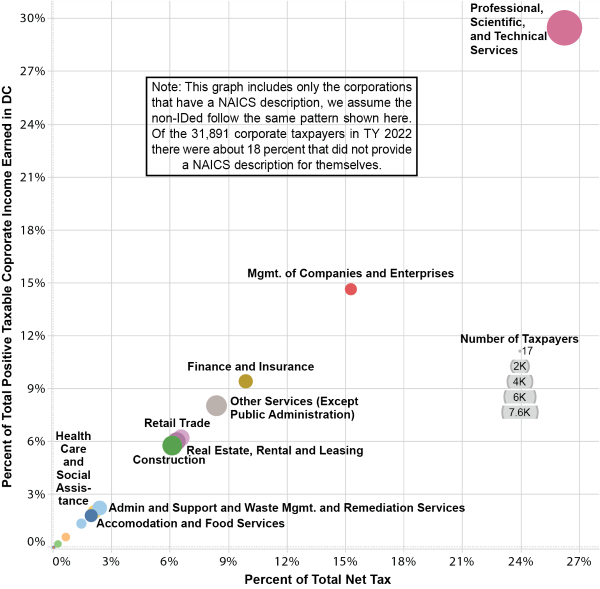
Which Industry Pays More Corporate Franchise Tax? (TY 2022)

Bubble chart with x-axis 'Percent of Total Net Tax' (0–27%) and y-axis 'Percent of Total Positive Taxable Corporate Income Earned in DC' (0–30%). Each bubble represents an industry sector sized by number of taxpayers. Professional, Scientific, and Technical Services is the largest bubble at approximately 24% net tax and 30% taxable income. Other notable sectors include Mgmt. of Companies and Enterprises (~15% net tax, 15% taxable income), Finance and Insurance (~9% net tax, 10% taxable income), Other Services (~9% net tax, 8% taxable income), Real Estate, Rental and Leasing (~8% net tax, 5% taxable income), Retail Trade (~6% net tax, 7% taxable income), Construction (~6% net tax, 4% taxable income), and Health Care and Social Assistance (~1% net tax, 4% taxable income). A note states the chart includes only corporations with NAICS descriptions and that 18% of the 31,891 TY2022 corporate taxpayers did not provide NAICS descriptions.


…Who our taxpayers are

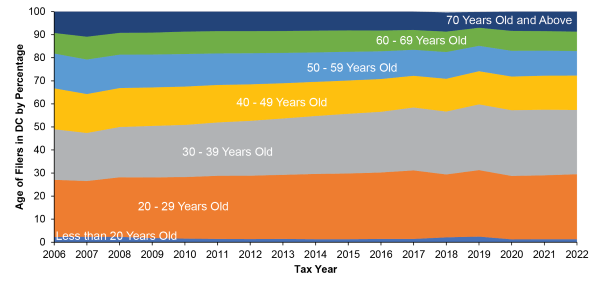
Age of Tax Filers in DC from 2006 to 2022

Stacked area chart showing the age distribution of DC tax filers by percentage from tax year 2006 to 2022. Age brackets from bottom to top are: Less than 20 Years Old (very small), 20–29 Years Old (large orange segment approximately 25%), 30–39 Years Old (large gray segment approximately 28%), 40–49 Years Old (yellow segment approximately 15%), 50–59 Years Old (blue segment approximately 15%), 60–69 Years Old (green segment approximately 8%), and 70 Years Old and Above (dark blue segment approximately 8%). The 30–39 and 20–29 brackets dominate throughout, and the chart shows a gradual aging of the DC filer population over time.

…And how they’re distributed across the city

Tax Revenue Collected from Residential Properties is Concentrated in Central DC (Total $ Amounts by Neighborhood, FY 2024)

Choropleth map of Washington DC divided by neighborhoods and Wards (1–8), showing residential property tax revenue collected by neighborhood as of January 2024. Colors range from light beige ($3K–$3.1M) to dark orange ($65.1M–$133.1M). Central DC, particularly in Wards 2 and 6, shows the highest concentrations of property tax revenue in dark orange. A callout note explains that although income wealth is concentrated in NW DC, most residential property tax revenue is collected in central DC and Wards 2 and 6 due to the density of taxpayers in those areas.


…With important historical context.

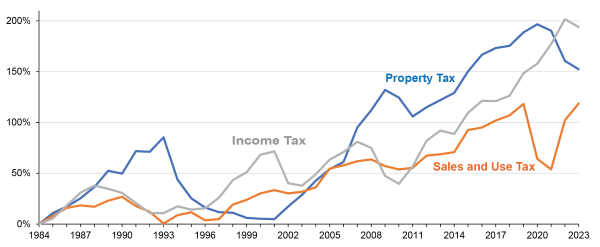
Total Percent Change in Tax Collections Since FY 1984 (FY 2017 Dollars)

Line chart showing the cumulative percentage growth of DC's three largest tax revenues — Property Tax (blue), Income Tax (gray), and Sales and Use Tax (orange) — from FY1984 (baseline of 0%) through FY2023. All three lines trend upward over time. Property Tax shows the highest growth at approximately 200% by 2023, with notable dips around 1993 and 2020. Income Tax reaches approximately 185% by 2023. Sales and Use Tax grows more moderately to approximately 120% by 2023.

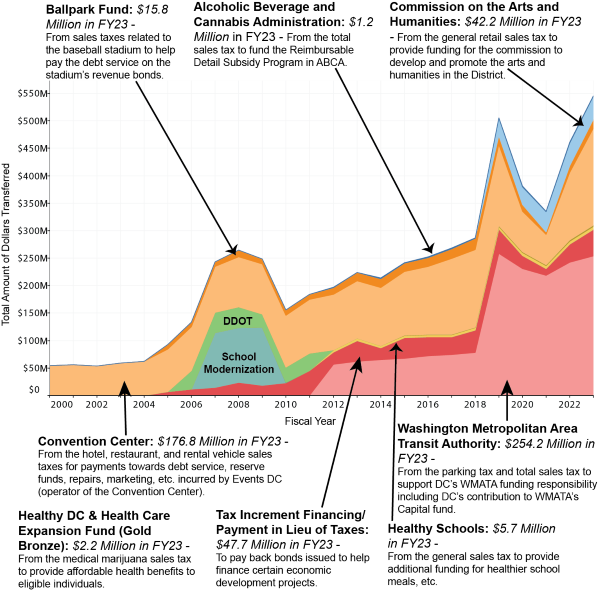
Totals for Dedicated Transfers of Sales Tax Revenue (Revenue Transferred from FY 2000-2023, in Millions)

Stacked area chart showing the total dollar amount of DC sales tax revenues dedicated to and transferred to various programs and agencies from FY2000 to FY2023. The y-axis ranges from $0 to $550M. Labeled segments identify each recipient: Washington Metropolitan Area Transit Authority ($254.2M in FY23), Convention Center ($176.8M in FY23), Tax Increment Financing/Payment in Lieu of Taxes ($47.7M in FY23), Commission on the Arts and Humanities ($42.2M in FY23), Ballpark Fund ($15.8M in FY23), Healthy Schools ($5.7M in FY23), Healthy DC and Health Care Expansion Fund ($2.2M in FY23), Alcoholic Beverage and Cannabis Administration ($1.2M in FY23), and historical transfers for School Modernization and DDOT.


Read the full guide with 50+ graphics