
Read our full Housing Tax Expenditure Review Report
The District of Columbia has one of the highest housing cost indices in the US. Rapid population growth, limited land availability, and low zoning density combine to keep property values high. However, the Office of the Chief Financial Officer’s Nationwide Tax Burden Study ranks the District’s residential real property tax burden among the lowest of 51 largest cities in each state and DC in the U.S.1 This is because DC has a low flat tax rate of $0.85 per $100 of assessed value for residential.2 DC also has a variety of property tax deductions and credits to help lower the property tax burden for its residents. This 4-part blog series and our new housing tax expenditure review report present DC’s four largest housing-related tax expenditures and describe their intended purposes. Furthermore, we analyze their impact and effectiveness, as well as their administrative simplicity in terms of achieving their stated goals. We also spotlight areas and suggest recommendations for improving their accountability and transparency per public management best practices.3
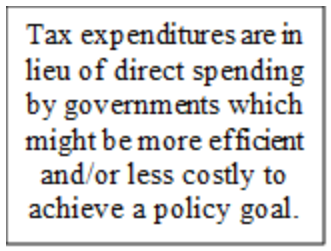
But first, what are tax expenditures? Tax expenditures, also called tax incentives, are preferences in the tax code that convey a benefit to certain individuals or businesses. These preferences come in many types, such as special exclusions, exemptions, deferrals, credits, deductions, etc. These usually alleviate the taxes levied on taxpayers’ gross income or the value of an owned asset. Instead of direct spending by a government through its annual budget, policymakers reduce the tax liability associated with certain actions or conditions so that individuals or businesses keep and spend the money that would otherwise be used to pay taxes. Tax expenditures also tend to decrease the tax base and, therefore, reduce government resources which may or may not be the most efficient and or less costly way to achieve a policy goal. Thus, tax expenditures are also called public spending by another name, and they must be evaluated like direct spending programs, which we do in our reports.
The four housing tax expenditures discussed in this blog series (see Chart 1) are the District’s real property tax homestead deduction, assessment increase cap credit, senior or disabled resident homestead deduction, and the Schedule H individual income tax credit. The Schedule H individual income tax credit is a type of property tax circuit breaker, so-called because it is meant to prevent overtaxing property taxpayers with the lowest incomes, much like an electric circuit breaker, which prevents the overloading of delicate electrical equipment. This 4-part blog series (of which this is the first) explains each housing tax expenditure and its impact on DC residents. We start the blog series by explaining the District’s real property tax homestead deduction.
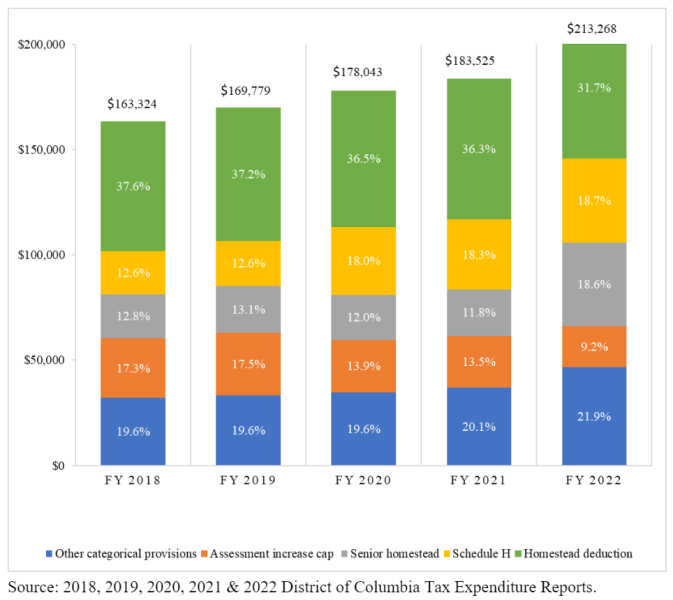
Chart 1: Estimated Aggregate Revenue Foregone, All Categorical Housing Tax Provisions (Aggregate TE Values in 000’s)
The Homestead Deduction:
Homeowners whose District home is their principal place of residence qualify to receive a deduction, which reduces the assessed value of their home. To qualify for the homestead deduction, a property taxpayer must file a onetime application with the Office of Tax and Revenue (OTR). For FY 2023, the deduction amount was $84,000 of assessed value saving about $714 in taxes. Since the mid-2000s the homestead deduction has been indexed to the Consumer Price Index to adjust for inflation. In FY 2022, the latest year of this report’s analysis, 101,142 property taxpayers received the homestead deduction, reducing property tax liabilities by an average of $669, which resulted in about $67.7 million in forgone tax revenue. Since 2012 (three years after the Great Recession), the number of beneficiaries grew steadily from 94,221 to a peak of 101,569 in 2021. Table 1 shows that in FY 2022 non-seniors benefited the most from the homestead deduction.4
Table 1: Homestead Real Property Statistics by Homestead Group, TY 2022

Source: ORA analysis of OTR real property tax data
How we got here:
When the homestead deduction was enacted in 1978 five years after the Home Rule Act, the District’s population as well as the tax base was shrinking, and policymakers wanted tax relief for residents who stayed. The population was shrinking due to a variety of factors: the creation of the US interstate highway system that made suburban living more cost-effective, lower-cost housing and amenities that made suburban living more appealing to middle to high-income residents, rising crime rates, and civil unrest in the aftermath of the civil rights movement. Property taxes for residents rose quickly as policymakers tried to squeeze more from a shrinking tax base. A report by the DC Council committee that established the homestead deduction highlighted large increases in assessed values for single-family homes, thus creating the deduction to address rising property tax burdens.5 Since the enactment, the amount of assessment value deducted has increased over time due to the Council passing laws like an annual cost-of-living adjustment and one-time dollar expansions starting in the 2000s, a time of rapid growth in DC’s housing assessments. Then, in the 1970s and now, there are similar behavioral and technological trends and past actions to keep in mind as policymakers deal with a new era in the District’s economy, i.e., the hybrid work model and taxation balance post-COVID-19 pandemic lockdown.
Impact of the homestead deduction:
Forgone revenue for the homestead deduction in FY 2022 accounted for 31.7 percent of the total forgone revenue for categorical housing tax expenditures6 and was the largest in this category. Since 2015, the homestead deduction amount has grown by 10.2 percent from $71,400 to $78,700, resulting in tax relief per property growing from $607 in 2015 to $669 in 2022. The homestead deduction has successfully limited the growth in the tax liability of those who benefited from the program. Median real property tax assessment growth averaged about 5.3 percent annually from 2015 to 2022. The annual average increase in property taxes for the median assessed valued homestead was about $233, which is lower than the annual average homestead deduction amount of $632 during the same period. Over this same period, the homestead deduction relieved an average of 13.7 percent of the property tax burden for the median assessed homestead. The percentage of relief to property tax burden for the median assessed home for all homesteads during this time never dips below 12.5 percent. Because the homestead deduction is a fixed amount, it gives proportionately higher relief to homes with lower assessed values (see Map 1). When we combine individual income tax data with real property tax rolls, we find a strong correlation between taxpayer’s income and the value of their homes.7 This makes the program progressive in its impact on beneficiaries (see Table 2). Since two enrolled homes with the same values receive the same amount of relief, the program is also horizontally equitable.8 After reviewing the original committee report establishing the homestead deduction program, Councilmembers wanted property tax relief, especially for those at the lower end of assessed values9, and our analysis reaffirms the success of this intent.
Map 1: The Homestead Deduction Tax Dollar Amount ($669) as a Percent of the Median Homestead’s Annual Real Property Tax Before Credits and Deductions by Assessment Neighborhood, FY 2022
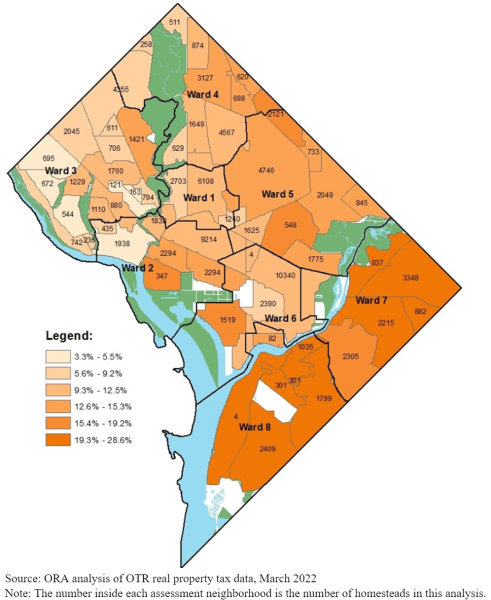
Table 2: Median Homestead Descriptive Statistics by Federal Adjusted Gross Income (FAGI) Quartile Groups, TY 2019

Source: ORA analysis of merged OTR individual income tax, real property tax, and OTR’s compiled homestead application data.
Note: The total number of homesteads shown here reflects the number of real property tax records we were able to match with their individual income tax returns by last name, address, and SSN.
Our analysis also found that there are very few (three percent of the total) owner-occupied cooperative units in 2022 receiving the deduction and policymakers may be interested to know why that is the case and if there are barriers to entry. Another area of improvement for policymakers to explore to help better recover lost tax revenue is closing a loophole in the law governing DC’s residential housing selling process. Currently, a homeowner can sell their home to a buyer without paying delinquent taxes or fees and without the buyer’s knowledge, for which they then become liable if the title company records the new deed within 30 days of the sale date. For further explanation and our recommendation, please see the report.
In conclusion, the delivery method of this tax relief is administratively simple based on its fixed amount, horizontally equitable to all enrolled users, and vertically progressive when comparing low to high-assessed homes and their incomes. Because property taxes are generally regressive and not based on ability to pay, this program somewhat makes up for this tax burden distribution discrepancy and achieves its legislative intent.
In the next installment of this blog series, we will present and discuss the assessment increase cap property tax credit and offer descriptive analyses and visualizations to review its effectiveness against its stated goal.
What is this data?
OTR supplied the data used in this blog and report and includes new and established tax and programmatic figures analyzed either by themselves or in a new dataset that approximately matches income and property tax records. The sources include real property public extract data (FY 2015-2022), individual income tax return data (FY 2015-2019), and a recently compiled list of approved paper or online homestead applications (FY 1978-2020). Due to the lag in income tax return data availability, income and property tax matching was limited to FY 2019, which is the latest year we could analyze at the time of this analysis.
Using the homestead applications provided social security numbers, last names, and square and lots (e.g., unique property identifiers) as the link between property and income tax data, we were able to fuzzy match over 40 percent of the total number of homesteads in each of the selected study years. The reason matches are approximate is that record matching relies on computed comparisons that are less than precise due to errors or misspellings on applicant forms or last name changes but fit the two other tests and are counted.
1 The household is assumed to be a family of three. Low-income renters in DC can receive a local income tax credit, e.g. the property tax circuit breaker, to offset their assumed property tax burden.
2 The future rate of this tax and others are currently under debate at the 2022-2023 DC Tax Revision Commission. See https://www.dctaxrevisioncommission.org/ for more details.
3 See Subtitle N of DC Official Law 20-155, the “Fiscal Year 2015 Budget Support Act of 2014” for ORA’s legislative mandate for this report.
4 Beginning in FY 2023, qualified US military veterans who have a total and permanent disability with a household income below $149,400 are added as a new type of homestead who could receive a $445,000 deduction in assessed value from their homestead property’s taxable assessment per tax year. After being accepted they are no longer eligible for the standard or senior or disabled homestead deductions.
5 Council of the District of Columbia’s Committee Report on Bill 2-127, the “Residential Property Tax Relief Act of 1977” Pg 5. Note: Cooperative housing associations and condominiums are a part of the group of beneficiaries in this bill.
6 Categorical means available to large groups of taxpayers.
7 TY 2019 income tax return data was the latest year we had at the time of analysis.
8 Horizontal equity means that the relief amount is equal and available to all individuals benefiting from the program, e.g. eligible owner-occupied homes, regardless of income.
9 DC Council Committee Report on Bill 2-127, the “Residential Property Tax Relief Act of 1977.” Pg. 36.