
The Office of Revenue Analysis annually compares DC’s tax burdens to those of the largest city in each state. The recently released Tax Rates and Tax Burdens 2014: A Nationwide Comparison calculates income, property, sales, and auto tax burdens for a hypothetical family of three at five different income levels across these 51 jurisdictions.
Because the District levies taxes typically employed by both state and local governments, the study compares the DC’s tax burdens to the combined state and local tax burdens the family would face if it lived in the largest city in each state.
Main Findings:
Looking at the combined burden of all four taxes by income level, DC tax burdens were lower than the average of the other 51 jurisdictions for families earning $50,000, $75,000, $100,000 or $150,000 a year. For the lowest income family earning $25,000, the District’s overall burden was higher than the average across the 51 cities. At the lowest income level, DC’s lower than average income tax burden (with the family receiving an Earned Income Tax Credit refund) is offset by the high cost of rent, and the resulting high burden of the property tax implicitly included in rental prices.
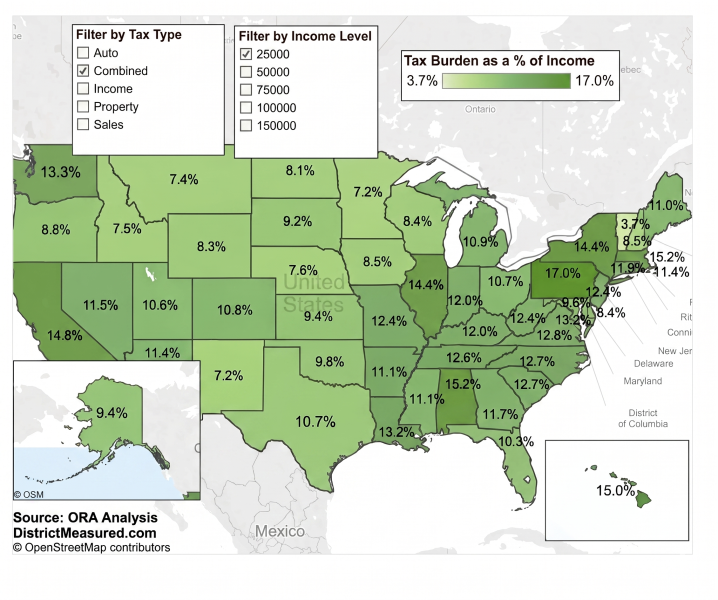
The map below presents the combined tax burdens (as a % of income) of all four tax types added together for a family earning $25,000 a year.
2014 Tax Burdens, by Tax Type and Income Level
Income tax:
Forty three states levy an income tax, and 10 of the cities surveyed in this study have an additional local income tax. The District’s 2014 income tax structure included four rates, with the highest rate of 8.95 percent applying to income over $350,000. DC’s income tax burden was a negative $732 for a family earning $25,000, meaning that the family would receive a refund through the Earned Income Tax Credit; this was below the average for the cities and states that had an income tax. The District’s income tax burden was slightly higher than the average for families at the other four income levels, resulting from its progressive structure.
2014 Income Tax Burdens for All Income Levels, $

Property tax:
All 51 cities in this study levy a tax on real property located within the city, with effective tax rates ranging from a high of $3.44 per $100 of assessed value in Detroit, Michigan, to $0.02 per $100 of assessed value in Jackson, Mississippi.
In 2014, the District taxed residential property at a rate of $0.85 per $100 of assessed value; and offered a $70,200 homestead deduction for owner-occupied residences. DC’s property tax burdens were below the 51-city average for the top four income levels (all of those assumed to own homes). However, for the family earning $25,000 a year and assumed to be renting, the District’s property tax burden was the second highest of all the cities. The high property tax burden for a renter in DC is due to the assumed property tax implicitly included in rental prices.
2014 Property Tax Burdens for All Income Levels

Sales tax:
Forty-six of the 51 cities studied are subject to some form of sales and use tax. The highest combined (state + local) sales tax rates are found in Los Angeles, California, and Columbia, South Carolina, both at 10 percent total. The District’s general sales tax of 5.75 percent is the fourth lowest of all 51 cities, when looking at total state and local sales tax rates combined. Consequently, sales tax burdens in DC were lower than the 51-city average at all five income levels.
View all sales tax rates used in this study.
Auto tax:
Residents in all 51 cities studied pay some type of automobile registration fee or tax–usually either a flat rate per vehicle or by weight of vehicle. In addition, personal property taxes on automobiles are levied in 13 of the cities.
The District’s annual auto registration fees range from $72 to $155, depending on vehicle weight, and are among the highest in the study; however, DC does not charge an annual excise tax or personal property tax on automobiles. District gas tax rates were 23.5 cents per gallon–also the median for all 51 cities–and DC auto tax burdens were below the 51-city average for all five income levels.
See the full report for more results and a description of the methodology.
What exactly is this data?
We calculated the tax burdens using housing value data from the US Census Bureau’s American Community Survey; income profile data from the Internal Revenue Service’s DC Statistics of Income; consumption information from the Bureau of Labor Statistics’ Consumer Expenditure Survey, and auto data from the National Automobile Dealers Association Used Car Guide, the Environmental Protection Agency, and the Department of Energy. Tax rate data were obtained from state and local tax officials, state and local government web sites, and third party sources such as the Federation of Tax Administrators and CCH/Wolters Kluwer.