
The COVID-19 pandemic has had a significant impact on many aspects of our lives, including where we choose to live. Recent migration data from the Internal Revenue Service shows that between 2019 and 2021, during the height of the pandemic, the District of Columbia experienced a net loss of over 16,000 tax-filing households, which equates to approximately 31,000 people leaving the city. This migration resulted in a net loss of more than $3 billion in taxable income, including more than $1.2 billion to the city’s inner suburbs.1
These net losses are the result of people who came in to and left DC between 2019 and 2021. This post looks at what the IRS data can tell us about these pandemic-era migrants and how they’ve affected the city’s taxable income. We combine two IRS migration data sets: those from 2019-2020 and 2020-2021.
Our main findings include:
- The majority of taxfilers stayed in the city. Those who stayed had higher average incomes than those who left. Those who left had higher average incomes than those who came in.
- The city lost taxpayers aged 26-44 with mid to high incomes. It gained younger, lower-income taxpayers (especially those under 26 years old).
- The top destinations for DC taxfilers were the city’s inner suburbs, to which DC lost a net of more than 8,000 taxfiling households and more than $1.2 billion in taxable income. The city lost a net of about $600 million in taxable income to Montgomery County, Maryland, alone.
The majority of taxfilers stayed in the city. Those who stayed had higher average incomes than those who left. Those who left had higher average incomes than those who came in.
While DC’s population decline from the pandemic is the largest in decades, the percent of taxfiling households lost is relatively low: the roughly 16,000 households lost make up about 5% of the more than 320,000 households that filed DC income taxes for 2019.2
Behind the net loss numbers are the components of migration the IRS tracks: the people who stayed in a jurisdiction from year to year, the people who left (out-migrants), and the people who came in (in-migrants). This data shows that in DC the vast majority of taxfiling households - more than 87% - stayed in the city from year to year from 2019 to 2020 and from 2020 to 2021. Those who stayed had higher average household incomes than those who left ($123,000 vs. $111,000), and those who left had higher average incomes than those who came in ($111,000 vs. $89,000). (These average incomes are weighted averages of incomes from the two datasets shown below).
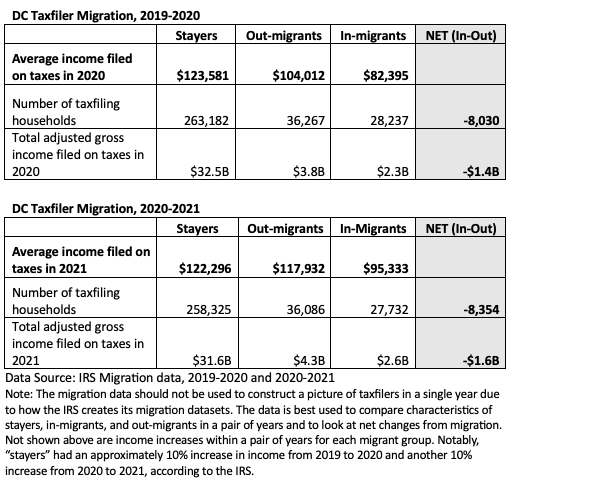
The taxfilers who left between 2019 and 2020 and 2020 and 2021 took with them approximately $3 billion more in taxable income than those who came into the city during that time. This amount represents forgone income, or the amount by which DC’s taxable income would have been higher had there been no churn of people in and out of the city. To put the amount of forgone income in perspective, it would amount to about $200 million in forgone income tax revenue if it were taxed at the city’s average effective income tax rate for individuals in FY 2021 (the most recent rate available) 3.
This does not mean the city’s taxable income or income tax revenues decreased during the pandemic. In fact, our tax data shows the city’s taxable income for individuals grew from around $36 billion in FY 2019 to almost $39 billion in FY 20214 – but without the loss from pandemic migration, the city’s taxable income would be $3 billion higher, according to the IRS migration data. Taxable income continued to increase through the pandemic because those who stayed in the city saw incredible income growth – about 10% a year, according to the IRS migration data (not shown in table above) – which outweighed the loss of taxpayers and the fact that those coming into the city had lower incomes than those leaving. There is also a time lag between when people leave and stop paying income taxes for a jurisdiction, since you pay taxes on the prior year’s income. For example, people who left the city in 2021 would still pay a partial year’s income tax to DC in 2022, meaning 2023 will be the first year the city feels the full impact of pandemic migration on income tax revenue.
The city lost taxpayers aged 26-44 with mid to high incomes. It gained younger, lower-income taxpayers (especially those under 26 years old).
Part of the reason we see income differences between those who stayed in the city, left, and came in, seems to be age: IRS data shows that the people who stayed were older and higher income than those who left, and those who left were older and higher income than the people who came in, on average.
When we use this age and income data to look at the movement of people and the impact of migration from 2019 to 2020 and 2020 to 2021, a clear picture emerges: the city’s net loss of taxfilers was concentrated among mid-to-high earners 26-44 years old. The only demographic among which we had a net gain of taxfilers due to migration was younger, lower-income filers less than 35 years old, but especially those less than 26 years old.
Movement among younger people is not surprising: research shows that throughout the U.S., younger people are more likely to migrate than older people.
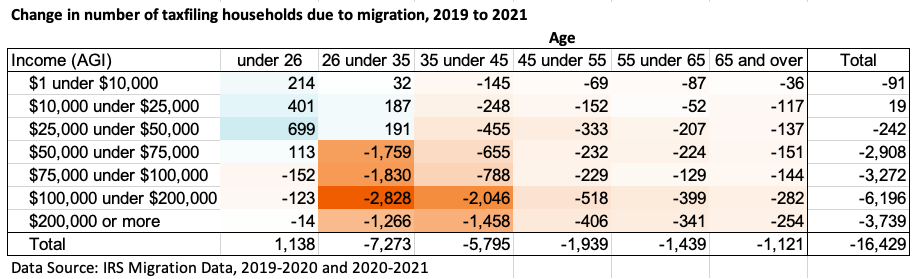
The high concentration of people between ages 26 and 44 who left might not be a surprise to those familiar with D.C.’s age demographics because this is roughly where our adult population was concentrated pre-pandemic, so there were more of them to lose. In fact, it was this demographic, in particular people in their mid-twenties to mid-thirties, that drove the city’s population boom in the 2000s and 2010s5. But even when factoring in the larger number of people in these age groups into the equation of taxfiler loss, we still see that the largest percent losses are concentrated among those aged 26 to 44, and the income divide between those we gained (lower income) and those we lost (higher income) becomes even more stark.
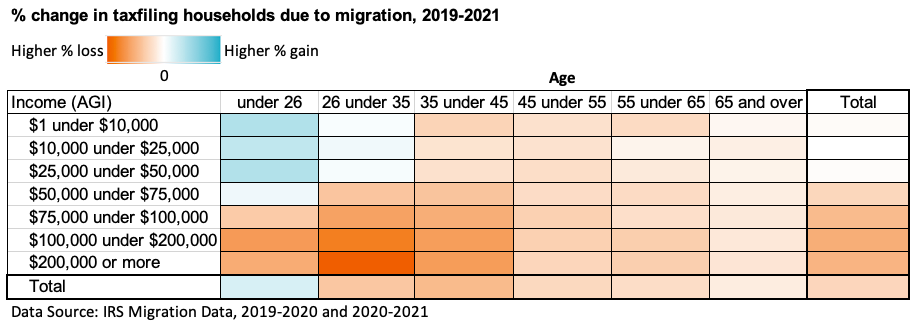
(We’ve left off the values in the chart above because the IRS migration data used alone will overstate the percent loss for each age and income group by up to a few percentage points, but the pattern of loss should still hold.)
Unsurprisingly, net loss of taxable income to migration tended to be highest among the highest earners (those with $100,000 or more in household income), but there were still sizeable losses among more moderate earners aged 26 to 34 due to the large numbers of people we lost in that age bracket.
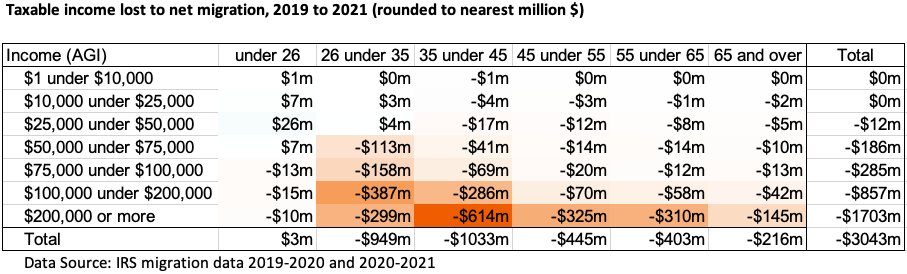
Keep in mind that all of these net income losses represent forgone income: the additional taxable income DC would have had if there had been no churn in residents between 2019 and 2021 (no people leaving, and no people coming in.) These losses do not reflect changes in income from year to year due to changing wages or income from other sources.
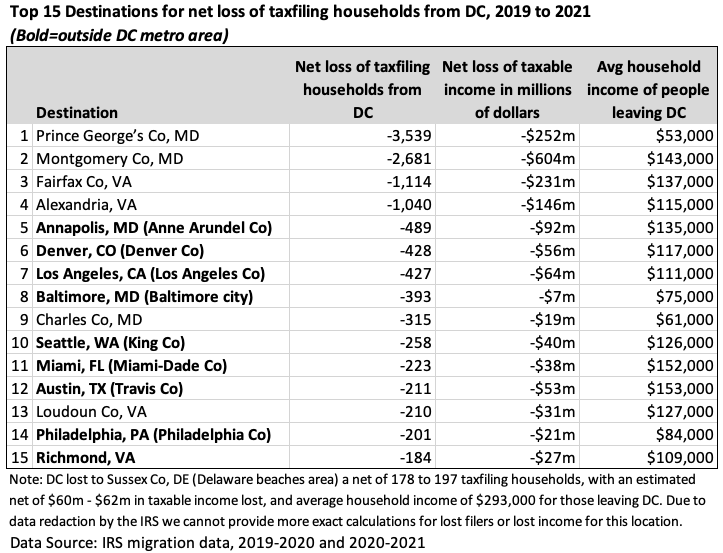
The top destinations for DC taxfilers were the city’s inner suburbs, to which DC lost a net of more than 8,000 taxfiling households and more than $1.2 billion in taxable income. The city lost a net of about $600 million in taxable income to Montgomery County, Maryland, alone.
The inner suburbs were by far the most popular destinations for DC migrants, as measured by the net loss of DC taxfiling households to other counties. Between 2019 and 2021 DC lost to its inner suburbs a net of 8,295 taxpaying households and a net of $1.27 billion in taxable income. To put that in perspective, that amount of income would generate $86 million in tax revenue if it were taxed at 6.81%, our average effective individual income tax rate for FY 20216. We define the inner suburbs as Montgomery and Prince George’s counties in Maryland; Fairfax and Arlington counties in Virginia; and the independent cities of Alexandria, Falls Church and Fairfax city in Virginia.
Prince George’s County, Maryland, was the top destination among counties, with a net gain of 3,539 taxfiling households from D.C. Prince George’s net gain of $252 million in taxable income from DC was the second highest among all counties, largely driven by the sheer number of movers (the difference in household income between those coming into and leaving the county was much smaller than most of the other inner suburbs.) Montgomery County, Maryland, packed the double whammy of gaining many movers from DC (2,681 net) with a large difference in income between those coming into and leaving the county, resulting in the highest loss of income from DC to any county: $604 million. Out of all the inner suburbs, Arlington County and Fairfax city were the only counties from which DC had a net gain of taxpayers.
Counties outside the DC metro area that were among the most popular destinations of DC taxfilers included counties encompassing nearby cities in the mid-Atlantic (Annapolis, Baltimore, Philadelphia, Richmond) as well as counties of major cities in the South and West (Denver, LA, Seattle, Miami, and Austin).
The only counties from which DC gained a net of 50 or more taxfiling households between 2019 and 2021 were Middlesex County, MA, which includes Cambridge and Boston’s western suburbs (+182 taxfiling households); Arlington County, VA (+87); Mercer County, NJ, which includes Princeton and Trenton (+56); and Suffolk County, MA, which includes Boston (+50). Generally speaking, suburbs of major cities and places with universities seemed overrepresented among the counties that sent more people to DC than they gained from it.
A note on Arlington: while DC had a total net gain of taxfiling households from there between 2019 and 2021, that total resulted from a net gain in 2020 that outweighed a net loss in 2021. DC also still lost income to Arlington over the two years combined since households leaving DC for Arlington had higher incomes on average than those coming into DC from there.
The data shows a pandemic effect that exacerbated prior patterns. The good news is Census shows we’re now gaining back population.
To what extent does this data show a pandemic effect versus patterns that existed pre-pandemic? Pre-pandemic IRS migration data from 2018 to 2019 shows a similar pattern of taxfiler loss but to a much lesser extent than during the pandemic years. The 2018-2019 migration data from IRS shows a net loss of nearly 2,000 taxfiling households compared to more than 8,000 from 2019 to 2020 and more than 8,000 again from 2020 to 2021. Like the pandemic-era data, the pre-pandemic data shows net gains among younger, lower-income taxfiling households and net losses among mid-to-high earners aged 26 to 44, but in the pandemic-era data, the gains are dampened and the losses are heightened. Recent research from the D.C. Policy Center using the same data also shows the net income loss we saw during the pandemic years was 2 to 3 times higher than in the years immediately preceding the pandemic.
The good news is the most recent Census population estimates show DC is regaining people. After a count of nearly 690,000 people in April 2020, Census estimates DC’s population dropped to a low of about 669,000 in 2021, and then increased modestly to nearly 672,000 in 2022.7 The gain was driven by international migration and births, according to the breakdown by Census.
What exactly is this data?
For the majority of the post, we used IRS migration data for 2019-2020 and 2020-2021, and in the last section we also used data from 2018-2019. The IRS migration data can be found here: https://www.irs.gov/statistics/soi-tax-stats-migration-data. (We used both the gross migration files and the migration data by individual state for DC.)
Each IRS migration file contains data on everyone who filed a U.S. income tax return in both calendar years listed for each dataset. The returns filed in a given calendar year reflect the prior year’s income; otherwise they were excluded from the dataset. Migration is based on the home address entered on the tax filing for each of those years. Both domestic and international addresses are included in the dataset. Excluded from the dataset are people who did not file U.S. taxes, for whatever reason, in either or both of the dataset’s calendar years for the prior year’s income. Keep in mind that the filling deadline in 2020 was pushed back to July 15.
End Notes
1We define the inner suburbs of DC as Montgomery and Prince George’s counties in Maryland; Fairfax and Arlington counties in Virginia; and the independent cities of Alexandria, Falls Church and Fairfax city in Virginia.
2Based on 321,839 full-year filers of DC taxes for 2019 income, from the Statistics of Income published by the D.C. Office of Revenue Analysis.
3The average effective tax rate in FY 2021 was 6.81%, per exhibit S-2G of the FY 2022 D.C. Annual Comprehensive Financial Report. FY21 is the most recent year for which this rate has been calculated. Since then, marginal individual income tax rates have increased for income over $250,000. While the IRS migration data reports federal adjusted gross income, and DC calculates local income tax using D.C. adjusted gross income, the two income measures are linked. Our calculation of forgone local tax revenue is meant to put the numbers in this report in context; it is not an exact measure of income tax loss.
4Total taxable income is calculated using individual income tax revenues from the Office of Revenue Analysis’s quarterly revenue letter and the average effective tax rate for individual income tax published in the FY 2022 D.C. Annual Comprehensive Financial Report.
5See the Census Bureau’s population estimates by state, available here: https://www.census.gov/programs-surveys/popest/data/data-sets.2022.List_1725564412.html#list-tab-List_1725564412
6The average effective tax rate comes from exhibit S-2G of the FY 2022 D.C. Annual Comprehensive Financial Report. FY21 is the most recent year for which this rate has been calculated. Since then, marginal individual income tax rates have increased for income over $250,000.
7Census estimates a pre-pandemic population of nearly 706,000 in 2019. Census tells us this estimate will be revised in 2024 based on updated information from the 2020 Census count. Since DC’s count for April 2020 was about 690,000 people – much less than the 2019 estimate for July 1 – it’s possible (but far from certain) the 2019 estimate will be revised downward. The Census population estimates and IRS data are intimately linked: IRS data is one of the main data sources Census uses to produce its domestic migration estimates. For more information see: https://www2.census.gov/programs-surveys/popest/technical-documentation/methodology/2020-2022/methods-statement-v2022.pdf