
When the CARES Act passed in March, self-employed persons were granted eligibility to apply for and receive unemployment benefits for the first time in history through the Pandemic Unemployment Assistance (PUA) program. The self-employed have always been a part of the economy, but the CARES Act marked a turning point for this business type with formal acknowledgement by legislators to the importance of supporting them. But who are the “self-employed”? The identity of the self-employed has long been a mystery. And like the solution to any mystery, one must ask the right questions, find the right clues, and piece together those clues to arrive at the truth.
With the self-employed people two narratives exist. In some cases, self-employed data is lumped in with businesses, and in others they are an employee for themselves. Even among policymakers, the overarching question of, “who and how many are self-employed?” is often debated. Are the self-employed only those people in the “gig economy” or are they established firms that we may frequent daily without knowing they are self-employed? To solve this mystery, we dug through publicly available federal data from the Census for the District of Columbia to gain a better perspective on this significant group. For the sake of simplicity, the self-employed referenced here are “single-person firms” where the owner is the only employee of the firm.
The Tale of the Self-Employed Establishment
From the business perspective, how many businesses within the District are considered one-person self-employed organizations? Using the Statistics on U.S. Businesses and Non-Employer Statistics Data from the Census for 2007 through 2017, Figure 1 reports that in the past ten years self-employed establishments have grown to account for 70 percent of all establishments in the District. Over this same period, the self-employed share of total establishments grew by 4.1 percentage points from 65.9 percent to 70 percent in 2007 and 2017, respectively.

Source: Census, Statistics of US Businesses and Non-Employer Statistics
As of 2017, 54,965 establishments within the District were registered as self-employed. While these establishments make a significant impact in terms of the number of establishments, their contribution to District total wages and salaries is limited. Traditional businesses with an owner and employees will often budget anywhere from 15 to 30 percent of sales for payroll. Assuming an average of 22.5 percent for payroll as a share of revenues, ORA estimated from sales receipts data the payroll size of self-employed versus employer establishments and compared their contribution to total District payroll.
From the Employee Narrative
In the self-employed establishment, payroll expense varies depending on the share after expenses remaining. As noted in Figure 2, the self-employed account for approximately 1.0% of all payroll earned within the District between 2007 and 2017.

The share of payroll accounting for those self-employed as employees modestly grew to 1.1% in 10 years, but overall remains marginal compared to the traditional employer establishments. Despite the total establishments that are self-employed, the core fact remains that they are still an employee and when thinking about payroll, this would only account for 60,000 potential employees within the District. Whereas employer establishments employed 527,004 employees according to the data in 2017. Thus, while the self-employed make a significant share of total establishments, as individual employees they are vastly outnumbered by those in traditional employment in the District.
The Red Herring of the Self-employed and the App-service Employment
Contrary to popular belief, self-employed individuals are not relegated to only ridesharing or other app service employment. As Figure 3 shows, the majority of the self-employed are to be found in the Professional, scientific and technical services sector, one of the District’s largest employment sectors, and a major driver of District economic growth in recent years.
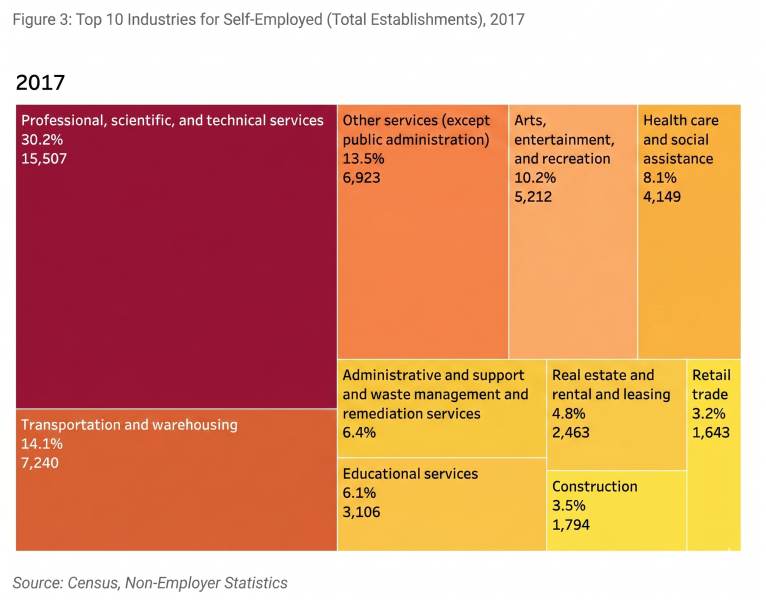
According to the Census data, in 2017 the total sales for self-employed establishments was $1.9 billion. In context, that was the going rate if you wanted to buy both the Tampa Bay Rays ($825 million) and Miami Marlins ($940 million) in 2017.. Looking back at Figure 3, Professional, scientific, and technical services accounted for 30 percent of the total self-employed establishments. Jobs within this sector include consultants, lawyers, and computer programmers. In terms of sales, the sector accounted for nearly 43 percent, or $821 million, of the total self-employed sales that same year. Real estate and rental and leasing sector, which includes real estate agents and property management companies, although a smaller share of total establishments accounted for an estimated 10 percent of the total sales in 2017. Combined with Professional, scientific, and technical services, the two sectors account for nearly 35 percent of the total establishments, and 53 percent of all self-employed establishment sales in 2017 or $1.0 billion. While many self-employed could be from ride-sharing, the data indicates a larger portion may be in more lucrative industries.
Concluding Remarks
The mystery of the self-employed has eluded policymakers for decades. Dueling narratives of self-employed as establishments or employees have complicated the issue even further. As establishments, the level of newly self-employed within the District has grown continuously since 2007 to become 70 percent of all establishments by 2017. Viewed as employees alone underestimates the significance of self-employed as an important driver of District economic growth, given the share payroll in 2017 accounted for by self-employed was estimated to be 1%. Contrary to popular thought, the self-employed are not restricted to retail or transportation, but are prominent in well-established skill-based sectors of the District economy. Overall, their contributions are not limited to tip-based income but have amassed to $1.9 billion in sales annually. However, there is no easy solution to the mystery of the self-employed, only more questions. But, the Census data may be the cipher we need to begin unraveling this mystery and answering those questions in the future.
For an interactive experience, check out our blog dashboard companion piece in Tableau, “The Mystery of the District’s Self-Employed.”