
In 1974 Congress passed legislation that included a requirement for the District to produce an annual study on tax burdens of the District and comparable cities across the nation. The first Nationwide Tax Burden Study was published in 1975, and not long after became a legacy report for the District. As the 50th anniversary of the legislation approaches, the Office of Revenue Analysis is proud to introduce the Nationwide Tax Burden Study Dashboard.
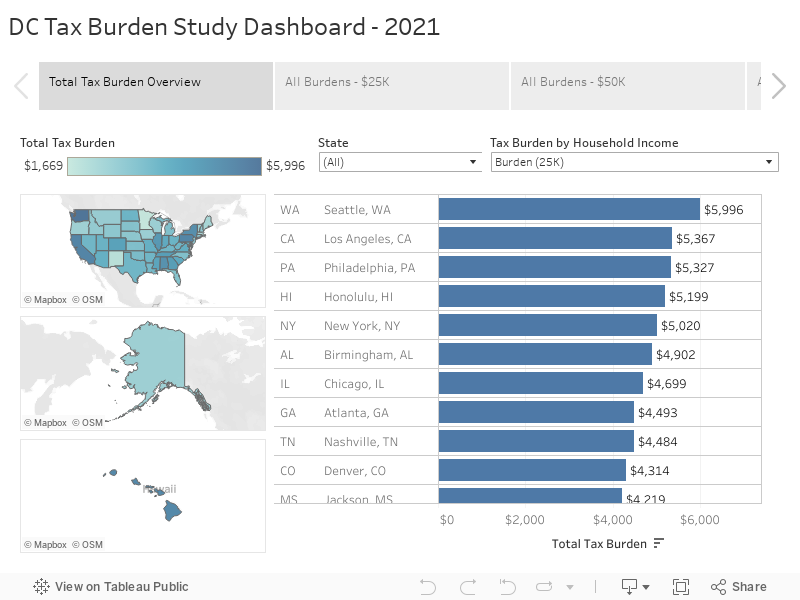
The study analyzes tax burdens on a family of three across the nation for five income levels: $25,000, $50,000, $75,000, $100,000, and $150,000. The first tab on the dashboard provides an overview of total tax burdens by income level. Users can then select different income levels to view total tax burdens by each state, and select states for comparison. The heat maps provided allow for a quick visual at the entire study of states to understand the highest vs. lowest tax burdens by income level for the current year.
The remaining tabs look at all the tax burdens by state broken down by income, property, auto, and sales taxes for each household income level. A filter is provided to allow users to select different states for comparison. Scrolling over each income type on the bar graphs allows users to view the amounts of each category of tax of the tax burden.
The most recent Nationwide Tax Burden Study is currently available for 2021 and can be found on the website: Nationwide Tax Burden Study - 2021.
To view the dashboard or other tax burden studies for prior years, you can visit the Tax Burden Studies page on the Office of Revenue Analysis website.