

As has been reported, the U.S. Census Bureau estimated that the District (D.C.), after years of population increases, lost nearly 20,000 people between April 1, 2020, and July 1, 2021. This is not surprising since moves out of the city accelerated after April 2020, when COVID-19 arrived in D.C. Now, nearly two years into the pandemic, are we seeing people return to the city? The data suggests yes. Apartment vacancy data and change of address data from the U.S. Postal Service (USPS) point to the city’s population reaching a low in the winter of 2020/2021, and then recovering to a large extent by the late summer/fall of 2021.
Apartment vacancy data from Delta Associates, which excludes vacancies in newly built units, shows vacancies in the District peaking the last quarter (Oct-Dec) of 2020 and first quarter (Jan-Mar) of 2021, with the increase in vacancy rate most pronounced for newer apartments with amenities (Class A). The vacancy rate then began to drop in 2021 and was below the pre-pandemic rate in the third quarter (Jul-Sep) of 2021. This is a strong sign of population recovery. Vacancy rates in the suburbs remained relatively flat through the pandemic, which perhaps isn’t surprising since our own research and others’ show the pandemic benefited the suburbs in this way.
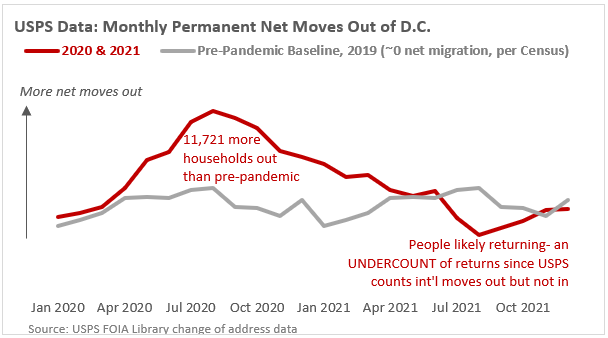
Data from the USPS, which provides the number of net moves out of the city, show a similar pattern of population loss then rebound. Net moves out peaked above their pre-pandemic levels in September 2020. They then declined but continued above pre-pandemic levels through early spring 2021. In July 2021, net moves out dropped below pre-pandemic levels for the first time, and remained below pre-pandemic levels through October 2021, signaling a gain in population. This likely gain was due to both more people entering the city and fewer people leaving than pre-pandemic. Unfortunately, it is difficult to get an exact count of population recovered using the USPS data because it almost certainly undercounts people returning.(1)
It is possible not all of this population recovery was captured in the latest Census estimate, since the estimate reflects the population on July 1, 2021, and our data indicates recovery was still happening then.
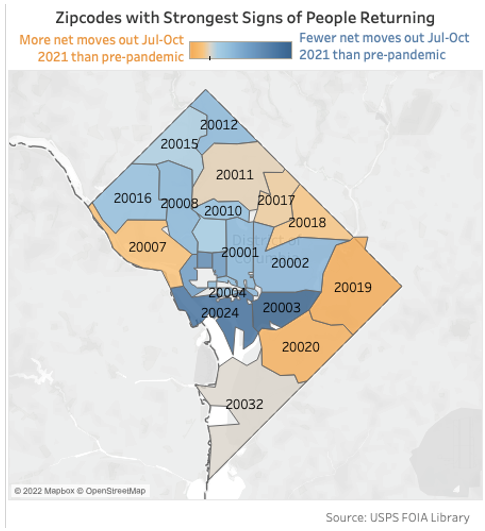
According to USPS data by zip code, the population rebound appears mostly to have been driven by the neighborhoods that lost the most people earlier in the pandemic: those in and near downtown. However, Navy Yard and south Capitol Hill (zip code 20003) had the strongest in-migration numbers in last summer and fall’s USPS data, despite showing middling population loss earlier in the pandemic. This could be due to the large number of new housing units there. Upper northwest (zip codes 20015 and 20012) also appears to have contributed to the rebound, which is somewhat surprising since it had nearly no pandemic population loss in 2020, according to our prior research.
On the flip side, USPS data shows neighborhoods on the eastern edge of the city still had higher out-migration than pre-pandemic when other neighborhoods were rebounding. East-of-the-river zip codes 20019 and 20020 had roughly the same elevated level of outmigration last summer and fall as earlier in the pandemic, though earlier in the pandemic they didn’t have the stark outpouring of people that we saw downtown.
(Note that zip codes 20007 (Georgetown) and 20017 (Brookland) could be showing higher out-migration due to the presence of universities, though we are not seeing similar patterns in other zip codes with universities.)
While the USPS data shows a somewhat uneven recovery among neighborhoods, apartment vacancy data shows vacancy rates very close to or below pre-pandemic levels among all neighborhoods for which we have data.(2) However, it would be possible for us to see pre-pandemic vacancy rates yet a lower population in some neighborhoods, or even city-wide, if household sizes shrunk due to some members of a household leaving and others staying (as may be the case with roommates or inter-generational households.)
There is also the question of whether those who left the city are similar to those who returned. A decline in school enrollment and evidence of moves to the exurbs could mean families were more represented among leavers than they were among returnees. This migration pattern could also lead to low apartment vacancy rates but a lower population than-pre-pandemic due to smaller household sizes.
There are signs the population recovery is slowing or ending, and even if D.C. has made it back to its pre-pandemic population, there is still the risk of low growth or population stagnation moving forward. In November 2021, USPS data showed outmigration returning to 2019 levels, when D.C. had close to zero total migration and negative domestic migration, according to Census, meaning significant population gains could have ended. Other cities faced the same plight pre-pandemic: Boston, New York City, and San Francisco all had negative domestic migration in 2019, but places like Austin, Raleigh, Denver, and the D.C. exurbs were attracting people and continue to do so. In fact, there were several reports noting that the pandemic increased moves to places already attracting people. Telework of course remains the big wild card; if it continues at substantial levels post-pandemic it could change not only the number of people who live in D.C. but the types of people who choose to live here.
End Notes
(1) The USPS data counts international moves out, but not in, which are typically a substantial portion of migration to D.C. The absence of international moves in will almost certainly lead to an undercount of people returning, even after normalizing the pandemic data by comparing it to pre-pandemic data.
(2) Delta Associates shows the following stabilized vacancy rates (rates that exclude new units) for D.C. neighborhoods:
| Q4 2019 | Q4 2021 | Vacancy Change | |
|---|---|---|---|
| Upper NW | 5.5% | 2.7% | -2.8% |
| Northeast | 6.2% | 3.6% | -2.6% |
| Columbia Heights/Shaw | 4.1% | 3.1% | -1.0% |
| Upper Ga | 3.7% | 2.8% | -0.9% |
| Central | 4.9% | 4.6% | -0.3% |
| NoMA/H St | 5.1% | 4.8% | -0.3% |
| Cap Hill/Riverfront/SW* | 4.8% | 5.2% | 0.4% |
*Note that while Cap Hill/Riverfront/SW shows slightly higher than pre-pandemic vacancies, this area had the highest apartment absorption city-wide in 2021, which is not reflected in the stabilized vacancy rate in the above table.
| Q4 2019 | Q4 2021 | Vacancy Change | |
|---|---|---|---|
| Upper NW | 3.0% | 1.7% | -1.3% |
| Mt. Vernon Square, NW | 3.8% | 1.8% | -2.0% |
| Southwest | 3.0% | 1.7% | -1.3% |
The Class A and B neighborhood data shown above from Delta Associates does not include data for neighborhoods east of the Anacostia River. However, CoStar data shows vacancy rates in “Anacostia Southeast” have dropped to pre-pandemic levels (from 7% in 2019 Q3 to 6% in 2021 Q3).
CoStar data also shows that Class C apartment vacancies city-wide dropped to pre-pandemic levels in 2021 Q2.