
The COVID-19 pandemic has wreaked havoc on US national, state, and local economies. One of the difficulties in assessing the extent of the economic impact is the lack of timely data. While measures to control the pandemic rapidly destroyed jobs in the retail and hospitality and leisure sectors, official US Bureau of Labor Statistics figures on jobs at the national level were not available until a week after the end of the month when the jobs were lost. And at the state and local level, the jobs numbers are available two are more weeks after the end of the month. Lag times for personal income and gross domestic product (GDP) measures are even longer. Initial estimates of national GDP are not available until a month after the end of a quarter, and it is even longer for state and local governments. For example, the US Bureau of Economic Analysis (BEA) published 1st quarter personal income figures for states and the District of Columbia on June 23, almost three months after the end of the quarter, and first quarter GDP figures for states and the District will not be available until July 30.
To track the unfolding impact of the pandemic, we have used various high-frequency data, including daily and weekly unemployment claims, smartphone counts in the District of Columbia, and credit card data on expenditures. Below we described the trends for the smartphone counts and credit card spending before and after the start of the lockdown to control the pandemic.
Smartphone
Daytime District population, which includes commuters and tourists and almost doubles the resident population, drives the economic activity in the District. So, tracking the impact of the pandemic on daytime population is a key measure of the pandemic’s impact on DC’s economy. Figure 1 below shows the smartphone counts in the District from January 2017 through June 2020. With schools and businesses closed, DC saw its lowest daytime population numbers, by a wide margin, since the data was first collected in January 2017. The data, provided to the District by Thasos, shows a 69% drop in the number of people in DC compared to the same period the year prior (April 1-June 1). To put that in perspective, the drop from the historically highest average week for DC (first week in April AKA spring break), to the lowest average week (winter holidays/New Year’s Day), is 37%.
Figure 1: DC Average Daytime Population by Week

When looking at specific days, blizzards and Christmas in DC have traditionally been the lowest days at 430k-450k daytime population, and the COVID-19 lockdowns have seen days in the 300k range.
Note: The data received by the District is one aggregate number per day and is therefore completely anonymized. The data pulls from a geofence that is aimed at capturing commuters and while it captures most of the city, it does not account for every person in DC every day.
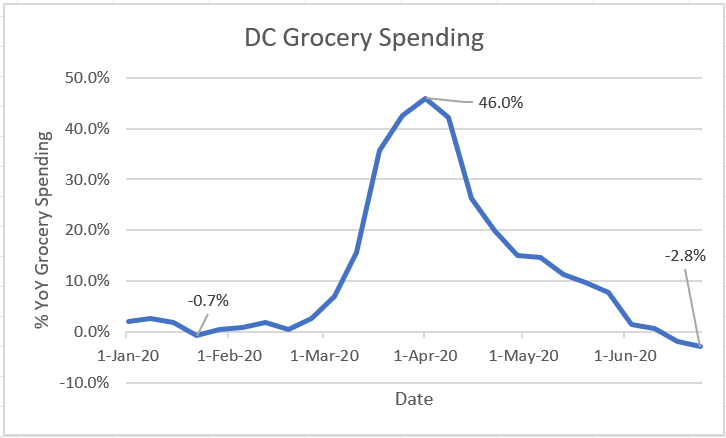
As Figures 2-4 show, some sectors had larger declines than others. Two of the hardest hit sectors are restaurants and hotels. Figure 3 shows that restaurant spending for the week of June 17 is 46% below the same period last year, while Figure 4 shows that hotel spending is almost 90% below the same period last year. On the other hand, Figure 5 shows that grocery spending soared at the beginning of the lockdown, rising as high as 45% in the first week of April compared to the same period previous year. Grocery spending has gradually fallen back to just above pre-pandemic lockdown levels.
Figure 2: DC Credit Card Spending, Restaurants

Figure 3: DC Credit Card Spending, Lodging

Figure 4: DC Credit Card Spending, Grocery
DC Spending Relative to US and other Jurisdictions
National credit card spending data has basically recovered to what it was in 2019. Cities are experiencing much larger declines due to loss of commuters and having a different mix of businesses compared to suburbs/rural areas. Figure 6 shows DC compared to a select group of cities. NYC has seen the largest total spending decline of any large city with a ~50% drop. DC has been down approximately 30% and Los Angeles down ~10% during this period.
Figure 5: Credit Card Spending by Jurisdiction
| Jurisdiction | June 2020 vs Year prior |
| USA | -2% |
| DC MSA | -8% |
| Los Angeles | -13% |
| Richmond, VA | -15% |
| Baltimore | -23% |
| San Francisco | -24% |
| DC | -32% |
| Philadelphia | -34% |
| Boston | -43% |
| NYC | -50% |