
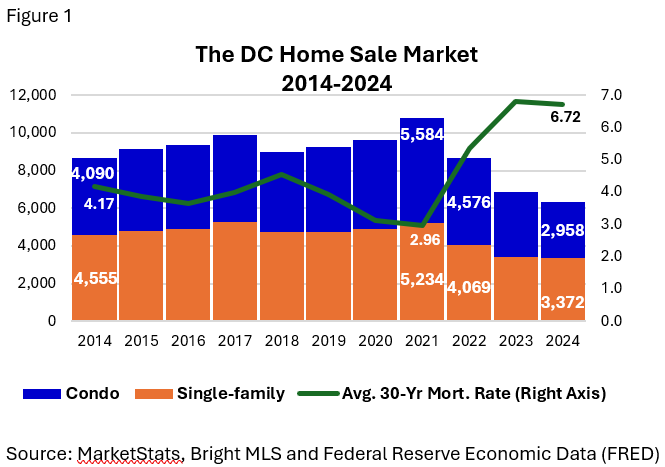
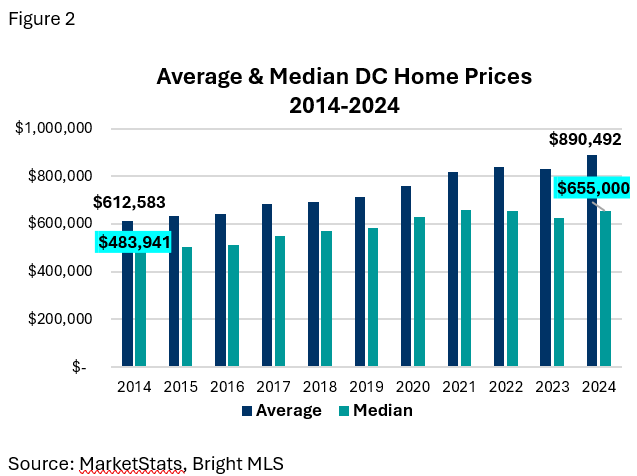
Homeownership trends in the District of Columbia are shifting amid housing affordability challenges and demographic changes. One notable trend is that more women are becoming homeowners. Figure 1 shows that 2,315 fewer homes (a 26.8 percent decrease) were purchased in the city in 2024 compared to 2014. This decline appears to be related to decreasing housing affordability. Average mortgage rates in 2024 are more than 2.50 percentage points higher than those in 2014 and over 3.75 percentage points higher than in 2021. Additionally, the median home sale price in the District has increased by $171,059 (35.3 percent) during this period (Figure 2). In 2024, 1,742 homes (27.5 percent of all sales) sold for more than $1 million, thereby driving up the average price well above the median.
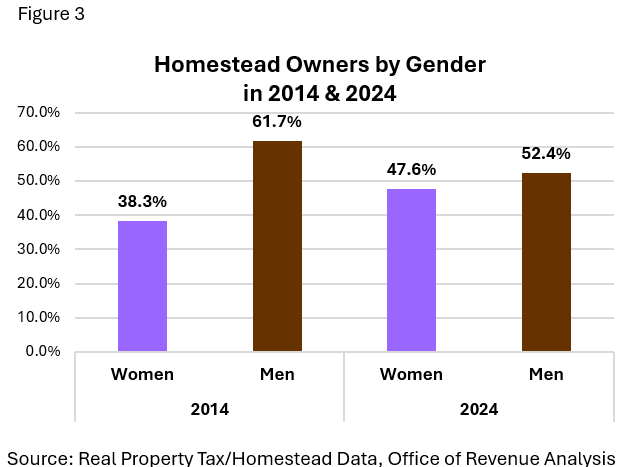
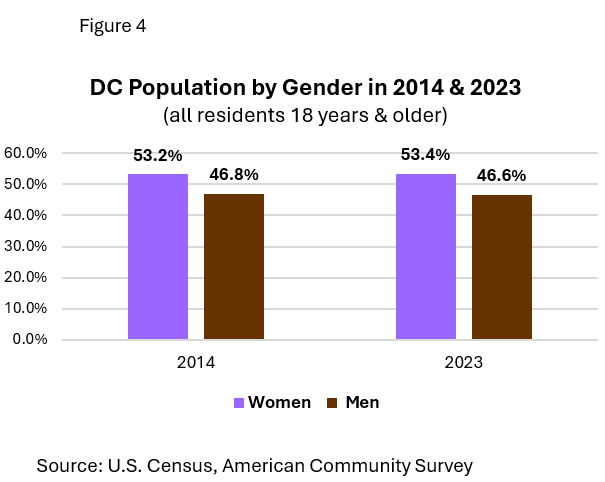
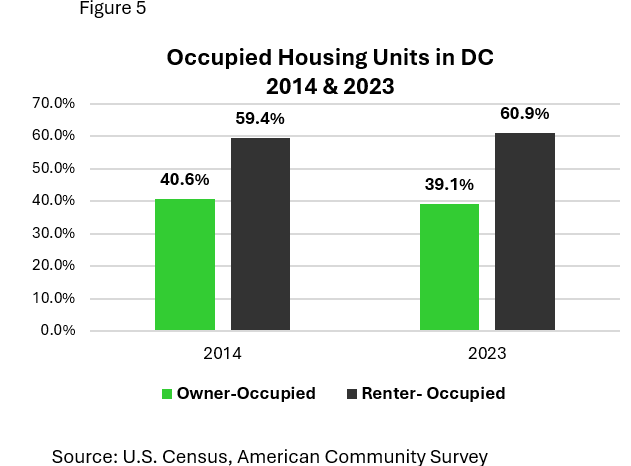
Despite declining housing affordability, a relatively high number of women are becoming homeowners, as shown in Figure 3. This shift occurs alongside only a slight increase in the number of women residents (Figure 4) and a small decline in owner-occupied housing units (Figure 5). In this blog, we explore several factors that likely contributed to the rise in female homeownership in 2024 compared to previous years and we highlight some economic implications of this development.
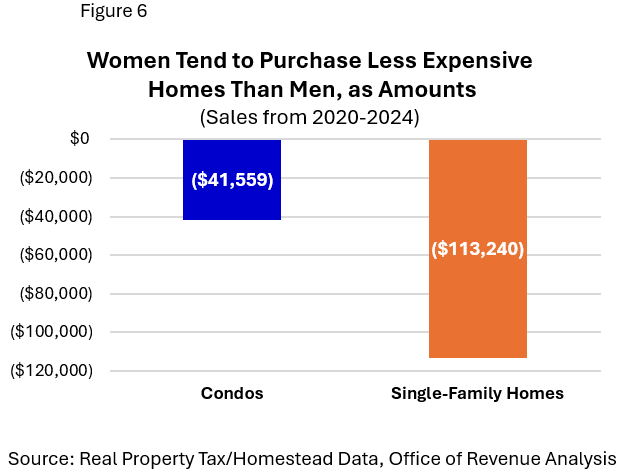
In 2024, DC’s housing market ranked among the most expensive in the U.S., with a median sale price of $655,000 compared to the national median of $420,300. Still, half of all homes sold in the city that year were also purchased for $655,000 or less. Women homebuyers in the District earn about 30 percent less on average than men homebuyers, according to Home Mortgage Disclosure Act data. Reflecting this income gap, Figure 6 shows that, between 2020 and 2024, women paid an average of $41,559 (7.3 percent) less than men for condominiums and $113,240 (11.4 percent) less for single-family homes.
In the District, about 35 percent of single-family homes sold in 2024 had last been purchased either between 2020 and 2024 or before 2015. Women homebuyers were more prevalent before 2015, while men dominated recent purchases (Figure 7). Condominium homes have grown in popularity across genders. Although earlier years saw a slightly higher proportion of female condo buyers (Figure 8).
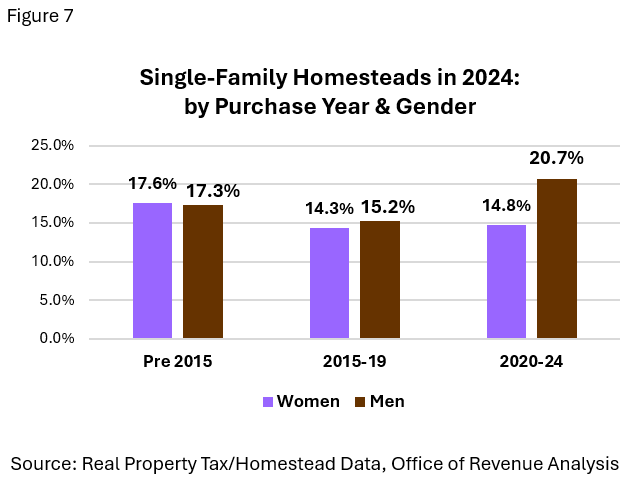
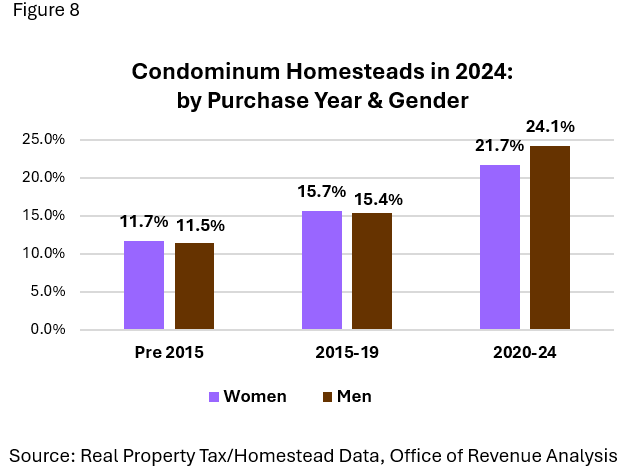
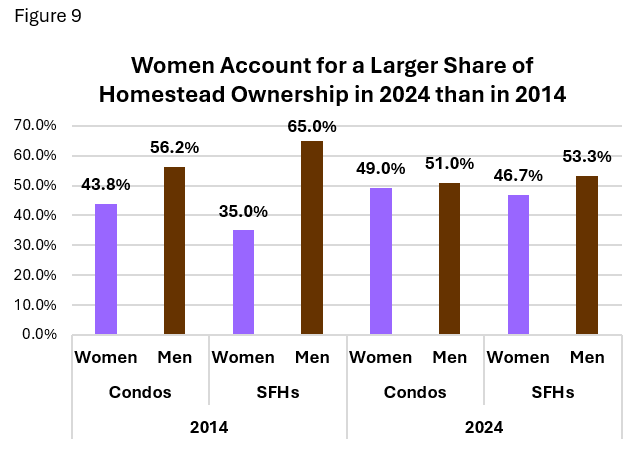
Figure 9 compares DC home ownership in 2014 and 2024. In 2024, women owned 49 percent of the city’s condominium homesteads, up from 43.8 percent in 2014. Similarly, women owned 46.7 percent of single-family homes in 2024, compared to only 35 percent in 2014.
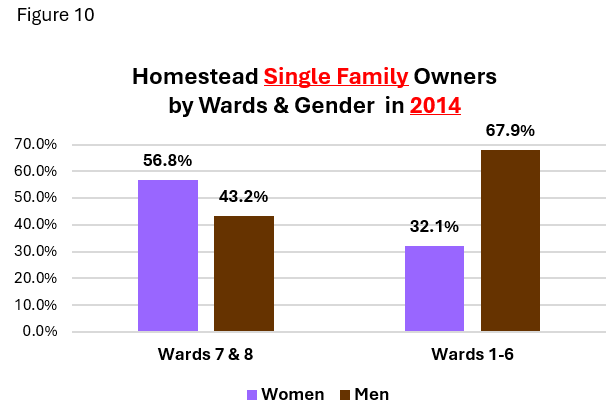
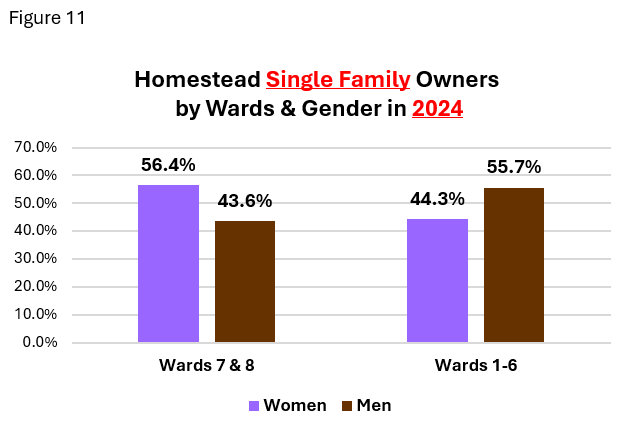
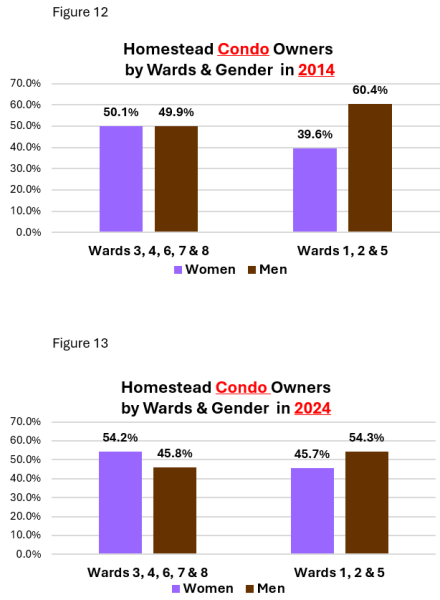
Women’s homeownership has also become more widespread across the District. Figures 10 and 11 show that in Wards 7 and 8, women still own more than half of all single-family homes. However, the share of homes owned by women has also grown significantly in other wards over the last ten years. Figures 12 and 13 show a comparable increase in women’s condo ownership, particularly in Wards 1 and 2, where condo prices are highest, as well as in Ward 5.
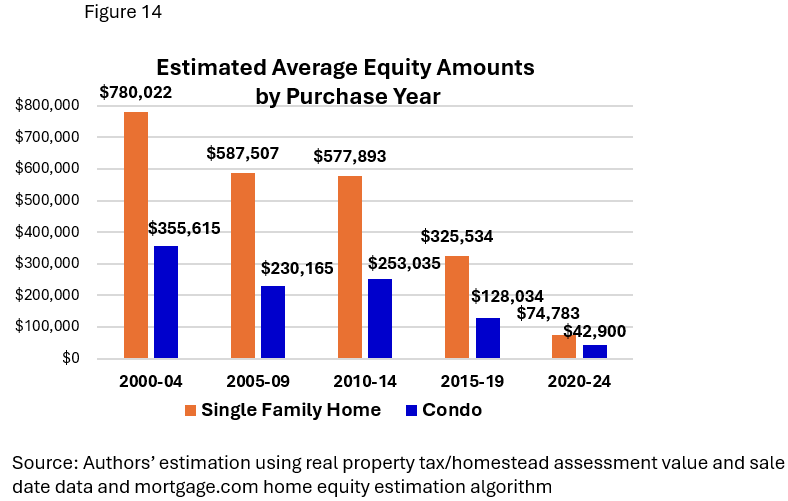
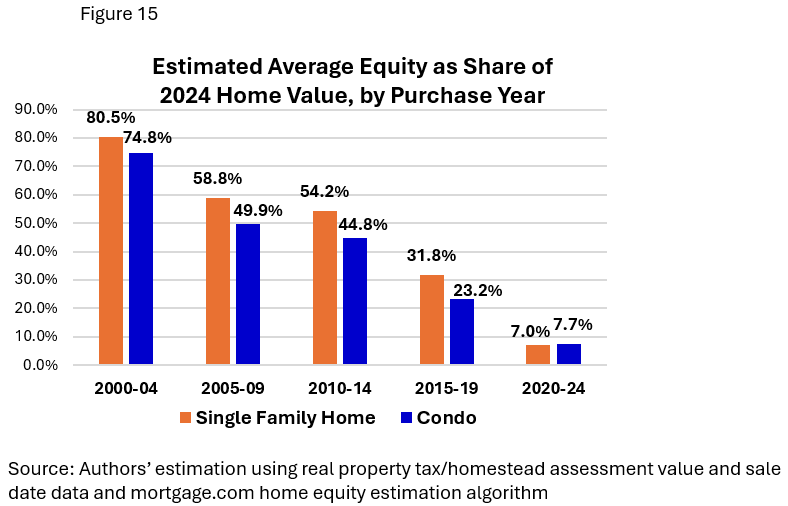
Homeownership remains one of the most reliable and accessible pathways to building long-term wealth, primarily through the gradual accumulation of home equity. Equity builds over time as homeowners pay down their mortgage and their property appreciates in value, turning their home into a valuable financial asset. As shown in Figures 14 and 15, for District homes with at least twenty years of continuous ownership, single-family homes had an estimated average home equity amount of $780,022, representing 80.5 percent of their 2024 assessed value. Condominium units had an average equity of $355,615, equivalent to 74.8 percent of their 2024 assessed value.
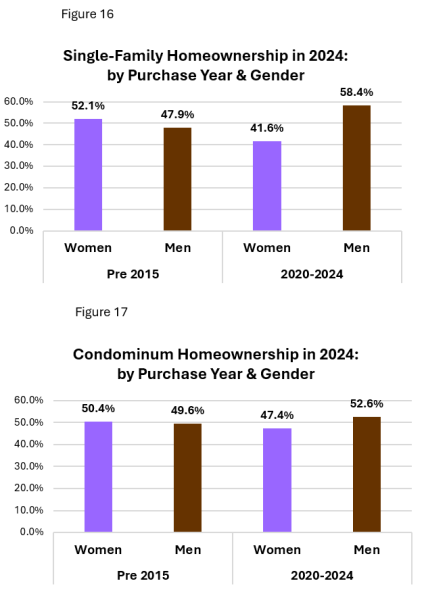
Although men are the primary buyers of homes in the District each year, Figures 16 and 17 reveal that in 2024, most homes bought before 2015 are now owned by women. Specifically, Figure 17 shows that men made up 58.4 percent of single-family home purchases from 2020 to 2024. However, for single-family homes bought before 2015 and still owned in 2024, women held 52.1 percent of the ownership. A similar pattern appears in the condo market, where men purchased 52.6 percent of condos between 2020 and 2024, but women owned 50.4 percent of those bought before 2015. These trends suggest women are more likely to keep their homes long-term, while men may be more inclined to sell within ten years. Additionally, these figures imply that a significant share of long-term household wealth among DC homeowners is probably held by women.
Conclusions
Although men buy most owner-occupied homes in the District each year, women now own a larger share of these homes than they did a decade ago. The data also show that women homeowners are more likely than men to maintain continuous ownership for ten years or longer. So, despite lower average incomes and owning less expensive properties, women’s longer homeownership tenures position them as key beneficiaries of wealth accumulation through home equity.
About this Data
Homesteads are owner-occupied residential properties registered with the Office of Tax and Revenue (OTR) by their current owner. OTR has verified that owners are legally domiciled in DC and, therefore, qualify for annual property tax relief. For this analysis, homestead data were used to ensure that the housing units included were owner-occupied and not rental properties, second homes, or other types of non-owner-occupied properties.
The homestead data came from the 2014 and 2024 OTR Real Property Tax database. In 2024, there were 100,894 homesteads in the city. Seventy percent were single-family homes, and the remaining 30 percent were condo units. (The city had 130,934 total owner-occupied housing units in 2023 according to the American Community Survey.)
Over 90 percent of the city's homesteads had a single owner listed in the database, which includes deed tax records. The remaining homesteads listed two individuals as owners, mostly one female and one male. This analysis only included homesteads with one listed owner to prevent confounding the gender analysis. To identify the gender of each homesteader, we used the SAS Dataflux Gender Analysis Node. This gender scoring algorithm assigns a gender based on the first names of property owners recorded in tax records.
The purchase year for each homestead is the most recent sale date on the tax record before December 31, 2024. Also, only homestead market sales are considered when examining homestead sales, excluding refinancings, foreclosures, and other non-arm’s-length transactions.
Home Equity amounts were estimated using the website https://www.mortgagecalculator.org/calculators/mortgage-principal-calculator.php . The website allows for the estimation of the remaining principal balance & home equity after paying on respective mortgage loans for a specific number of months or years. To determine the average home equity for groups of properties purchased during similar time periods, we used the most recent average recorded sale prices for the cohorts of properties, as depicted in Figures 14 and 15. We assume that, on average, homeowners made a 7% down payment and financed the remaining average estimated balance with a mortgage loan. We assume a 30-year loan for all properties and that monthly mortgage payments have been made from the purchase date until December 2024. We also used the average home assessment value from the Office of Tax and Revenue for 2024 as the most recent appraisal value for the cohort of homes. Additionally, we applied the national average annual interest rate for a 30-year mortgage for the year the home was purchased.
Other data used: MarketStats, Bright MLS home sale data for the District of Columbia 2014-2024; Federal Reserve Economic Data (FRED); and U.S. Census/American Community Survey 2014 & 2023.