

A new study from the Office of Revenue Analysis shows that most Washington, DC tax filers who relied on self-employment for their livelihood from 2010-2018 had low incomes and had more stagnant incomes than their neighbors with steady wage employment. Most strikingly, when a tax filer switched from a typical wage-earning job to self-employment, their reported income dropped by 20-50 percent. Switching away from self-employment had the opposite effect, raising incomes by 65-85 percent. The minimum wage appears to play a key role in driving this divergence for some. This self-employment income drop is a cautionary datapoint about the effect of the gig economy and independent contracting on Washingtonians’ economic prospects and mobility.
Our analysis tracks the IRS-reported taxable incomes of Washingtonians from 2010-2018, divided by income level and employment type. We divided all 2013 unmarried tax filers into five bins based on their 2013 income levels (Table 1).
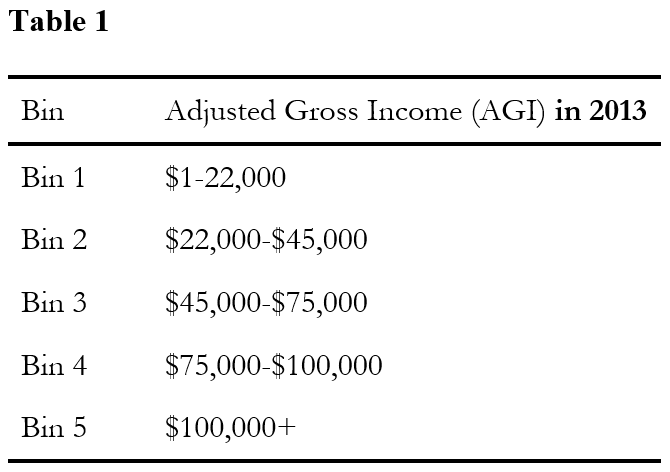
And, we divided these same tax filers into two broad types of employment. Generally, there are two ways to work for pay: earn a wage as an employee, or work for yourself through self-employment and keep the profits your business earns. We focused on tax filers who rely heavily on these two income types:
- Primarily wage-earning: Almost all of the income they report on their taxes is wage or salary income from a job.
- Majority self-employed: Less than half of their tax income is from wages, and they report being self-employed (by filing IRS Schedule C or SE).
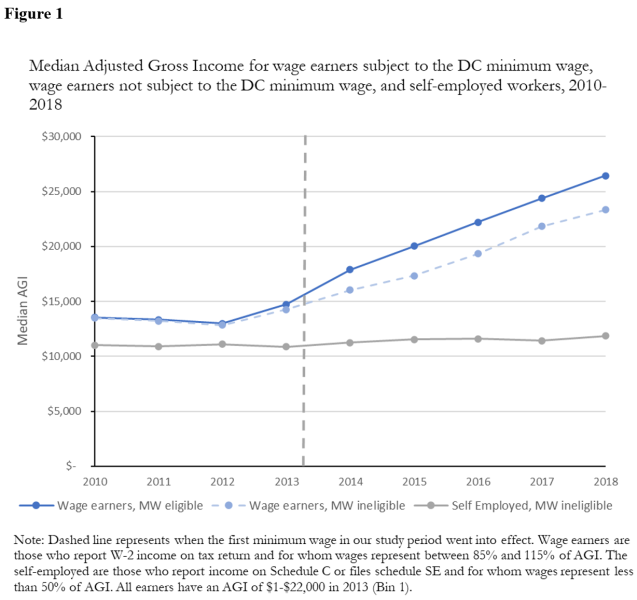
When we look at the cohort of tax filers in Bin 1, self-employed tax filers (gray line) appear to have persistently stagnant incomes, while wage earners (solid and dotted blue lines) saw large increases in income post-2013.
What drove the apparent divergence between wage-earners and the self-employed? One possible explanation is that in December 2013, Washington DC passed a minimum wage increase, which gradually raised the minimum wage from $8.25 per hour in 2013 to $13.25 per hour in 2018. The minimum wage also appears to have raised the incomes of low earners who worked at jobs within DC (solid blue line, Figure 1) above those who worked at wage jobs in Virginia, Maryland or for the federal government (dotted line).
Switching Employment Type
The law treats employees and self-employed individuals very differently. Of particular importance for our study is that minimum wage and overtime protections do not apply to self-employed workers. Relatedly, this research shows that there is a substantial income drop associated with self-employment.
As the rising minimum wage increased the earnings from wage employment, low-income individuals seem to have moved away from self-employment and toward minimum wage-protected jobs. The number of low-income, majority self-employed tax filers was increasing from 2010-2013, but then started to shrink after 2013, falling by 1,500 people from 2013-2018, especially among low earners:
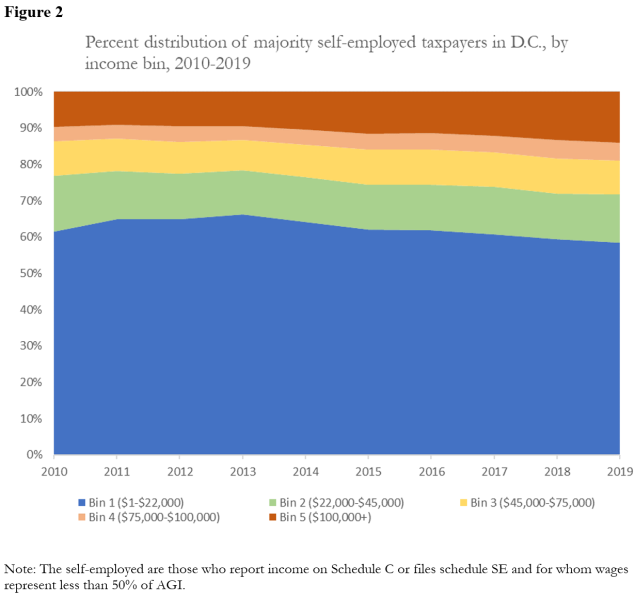
When we divide DC tax filers by income and employment, we find that most self-employed people earned low incomes. About 60 percent of self-employed tax filers were in the lowest income bin, earning $1-22,000 per year (See Figure 2). Common professions for low-income self-employed people or independent contractors include drivers, janitors, home/office cleaners or hair stylists.
One possible reason for the falling number of majority self-employed, low-income tax filers in DC is the large income drop associated with self-employment. Despite similar pre-2014 income trajectories, our study finds that tax filers who became self-employed earned less in 2018 than they had in 2010 (See Figure 3). Conversely, those who left self-employment for a wage-earning job doubled their income from 2013-2018.
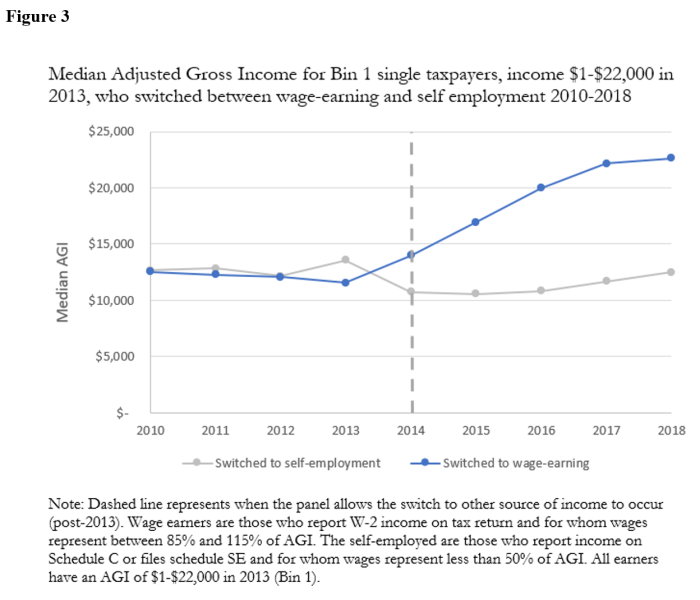
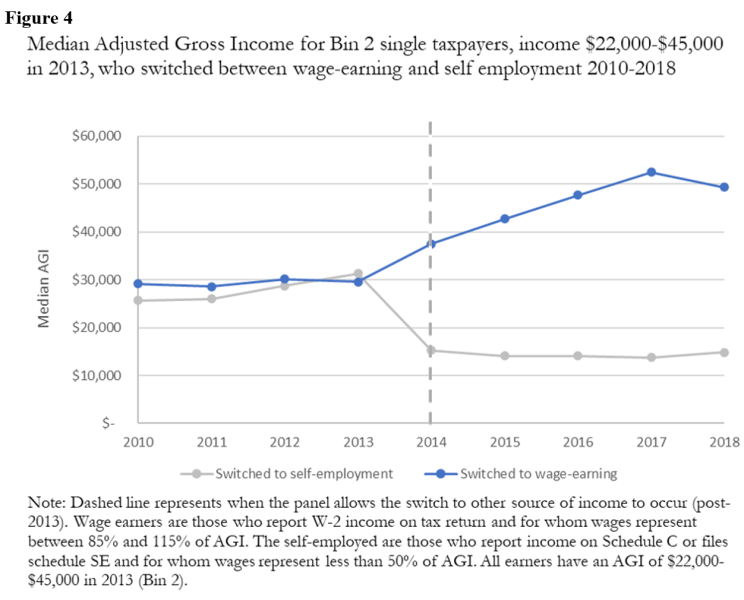
Moreover, this pattern still holds for middle-earning switchers unaffected by the minimum wage. Tax filers making from $22,000 to $45,000 in 2013 lost approximately half of their income when they became self-employed. Even higher-earning tax filers saw persistent income gains when they left self-employment for a wage-earning job. Those who became wage-earners made about $50,000 in 2018, up from $30,000 when they were self-employed in 2013 (Figure 4).
This study establishes that there is a tax income drop associated with self-employment at most income levels, and shows that since the minimum wage was raised in DC incomes have diverged at the bottom. The minimum wage appears to have increased the incomes of those who work at DC establishments by $3,100 above similar low-wage workers who worked in Maryland and Virginia, while the incomes of the self-employed have stagnated. This study also documents that switching to become self-employed is associated with a 20-50 percent income drop. Other research does show that the self-employed have more opportunities for tax avoidance or misreporting than wage-earners, which could mean that their reported tax income is lower than their actual income, though that dynamic seems unlikely to completely explain the self-employment income drop.
The reversal in the growth of the low-income self-employed population after 2013 suggests that government policy can affect the number of people who are wage workers and who are self-employed. To the extent that policymakers are making decisions along this margin, encouraging tax filers into wage-earning seems to increase their reported income, tax collections, and observed economic mobility.
What data is this?
The data in this study comes from annual individual income tax return records for all tax filers in the District of Columbia for years 2010 to 2018.