
The District of Columbia’s property tax circuit breaker, officially known as the Schedule H Homeowner and Renter Property Tax Credit, aims to provide property tax relief to very low-income households. The policy enables eligible claimants to claim a refundable tax credit on their District income tax returns when their property tax liability exceeds a certain percentage of their income. The existing policy divides claimants into two groups: those who are 70 or older and those younger than 70. However, a new study (See here) reveals that the more significant differentiation among program recipients doesn't revolve around age but rather centers on the more fundamental classification: homeowners and renters.
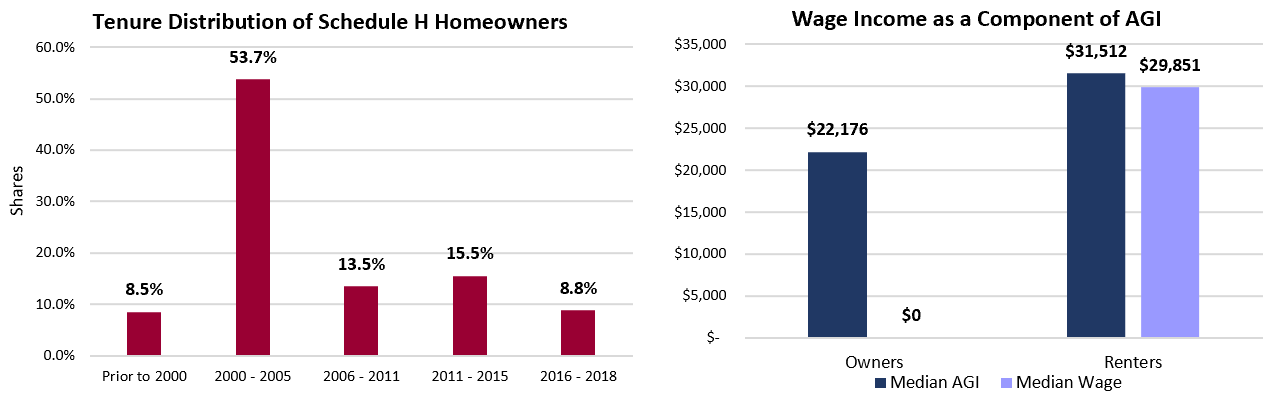
Figure 1 shows that in terms of age, renters and homeowners are markedly different. In 2018, renters tended to be under 35 years old and have earnings between $25,000 and $51,000, while owners are primarily senior citizens earning below $25,000 (Figure 2) and bought their homes in the early 2000s (Figure 3). Wages and salaries were the primary source of income for renters who claim the Schedule H tax credit. In contrast, non-wage sources like social security benefits, pensions, annuities, IRA distributions, taxable interest, and dividends were the primary sources of income for owners. This is illustrated in Figure 4, which shows that the median owner has no wage earnings, while the median wage earnings of renters were $29,851.
Figure 1 Figure 2
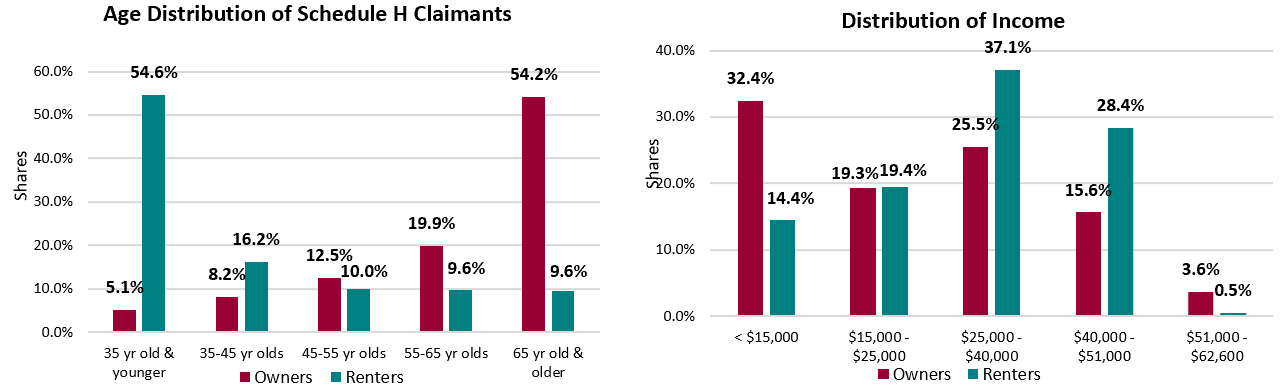
Figure 3 Figure 4
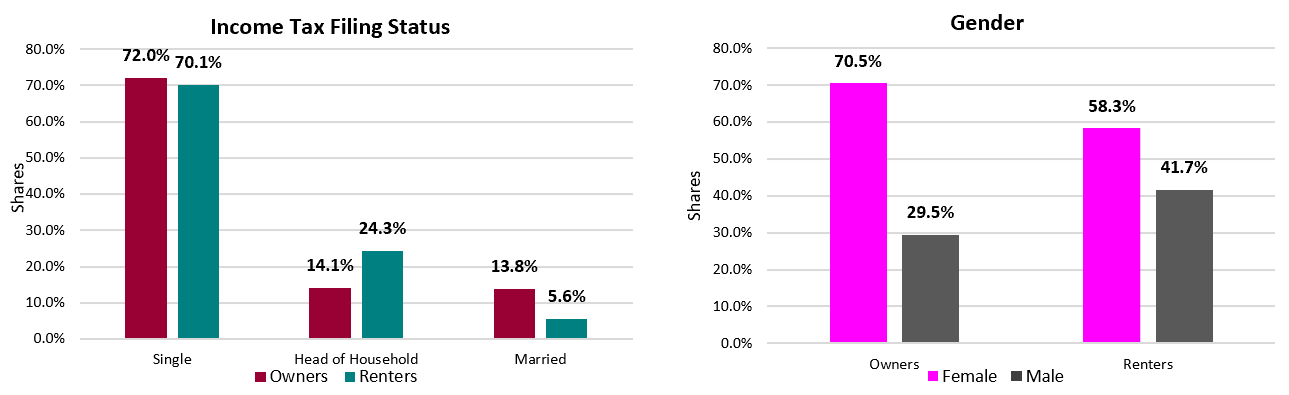
However, renters and owners were also largely unmarried female claimants (Figures 5 and 6).
Figure 5 Figure 6
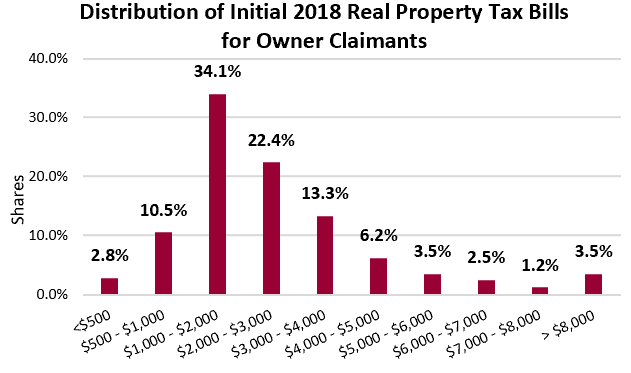
The median yearly apartment rental expenses for renters who claim the credit in 2018 was $12,000, with nearly half paying between $10,000 and $15,000 in annual rent, as shown in Figure 7. This means the median monthly rent for renters in 2018 was $1,000. Figure 8 shows that for 53.2 percent of owners claiming the credit in 2018, home values ranged from $300,000 to $600,000. Their median home value was $463,040, and their median property tax liability (before the Schedule H tax credit) was $2,084. According to the study, approximately 2.6 percent of the median renter's income went toward their real property liability before the Schedule H tax credit. In contrast, the median owner dedicated 9.4 percent to their pre-credit real property liability.
Figure 7 Figure 8
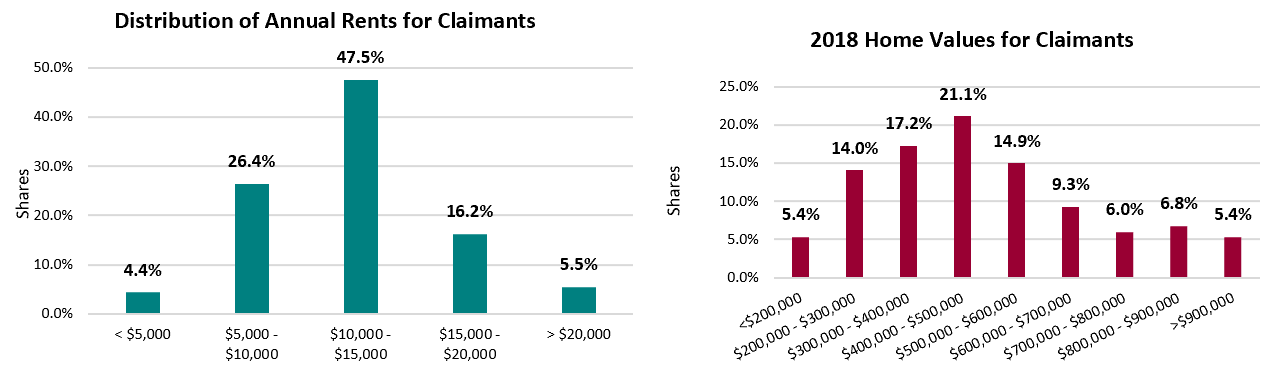
Figure 9
Ultimately, the policy provided $28.7 million in refundable income tax credits, reducing property tax burdens for 34,495 low-income households in the District, with over 56 percent of the claimants receiving the maximum credit of $1,025.
Table 1
| Renter Claimants | Owner Claimants | Total | |
|---|---|---|---|
| Received Maximum Credit — # Claimants | 15,967 | 3,317 | 19,684 |
| Received Maximum Credit — Total Credit | $16.4 mil | $3.8 mil | $20.2 mil |
| Received Maximum Credit — Mean Credit | $1,025 | $1,025 | |
| Received Less than Maximum Credit — # Claimants | 11,935 | 2,876 | 14,811 |
| Received Less than Maximum Credit — Total Credit | $7.2 mil | $1.4 mil | $8.6 mil |
| Received Less than Maximum Credit — Mean Credit | $600 | $497 | |
| Total Claimants | 27,902 | 6,593 | 34,495 |
| Total Claimants — As a % | 80.9% | 19.1% | 100.0% |
| Total Credit Amounts | $23.5 mil | $5.2 mil | $28.7 mil |
| Total Credit Amounts — As a % | 81.9% | 18.1% | 100.0% |
What is this data?
This study used DC individual income and federal individual income administrative tax data for tax year 2018 and DC real property tax data for tax year 2018. To determine the gender of tax filers, we employed software with a gender scoring algorithm, primarily relying on the first names recorded in tax records.