The District of Columbia homestead deduction provides tax relief to resident homeowners. Resident homeowners may deduct $87,050 (in 2024) from the assessed value of their home before calculating property taxes owed. The senior citizen and disabled person credit (commonly referred to as the senior credit) provides additional tax relief to senior citizens and people with disabilities, who often have fixed income, and may struggle with rising property taxes. Income-eligible senior citizens and disabled persons owning and living in their homes are given a 50 percent reduction in their real property tax liability. (See here.)
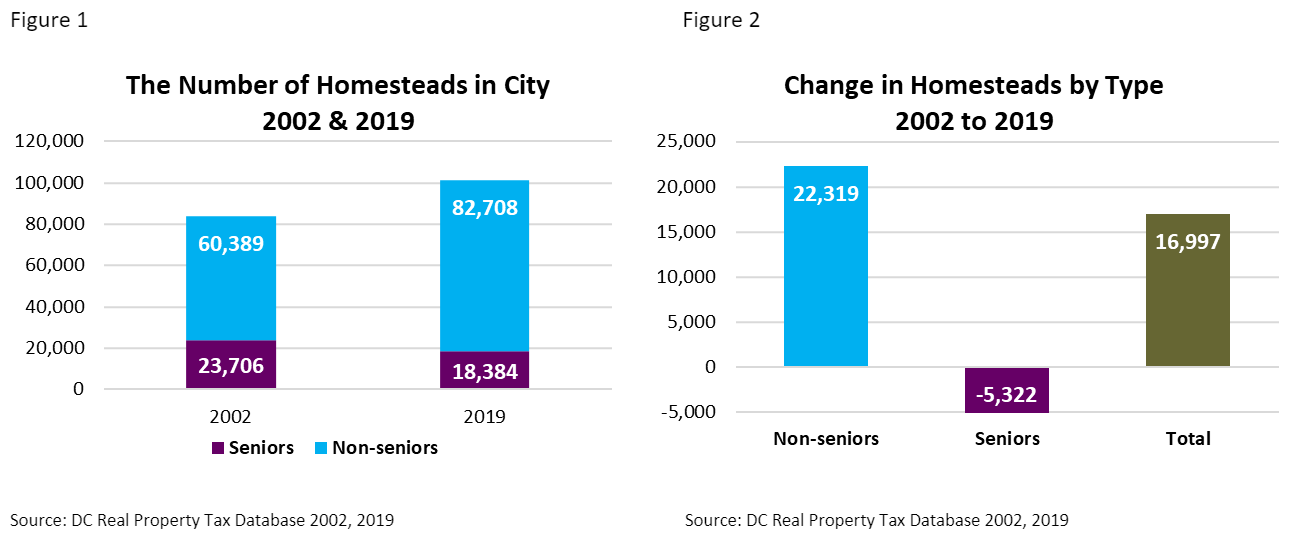
While the senior credit effectively reduces the annual property tax bills for senior owner-occupied homes by 50 percent, many senior homesteaders combine the senior credit with other property tax relief programs, such as the Schedule H tax credit. (See here and here for a full list of other available credits and deductions). The combined effect of these tax relief programs can lower the property tax bills to no more than $100 for some seniors. However, a 2019 study found (See here) that, despite the generosity of these tax relief programs, many new senior homeowners do not take advantage of these programs. The study found that despite a 20.2 percent increase in property taxpayers claiming the homestead deductions between 2002 and 2019, there was a 22.5 percent (5,322) decrease in senior owner-occupied homes claiming the homestead deduction over this same period (see Figures 1 and 2). This analysis looks at the change in the number of senior homestead claimants in more recent years and compares the economic and demographic characteristics of senior homestead deduction claimants to those of non-senior homestead deduction claimants.
Change in the Number of Senior Homestead Claimants in Recent Years
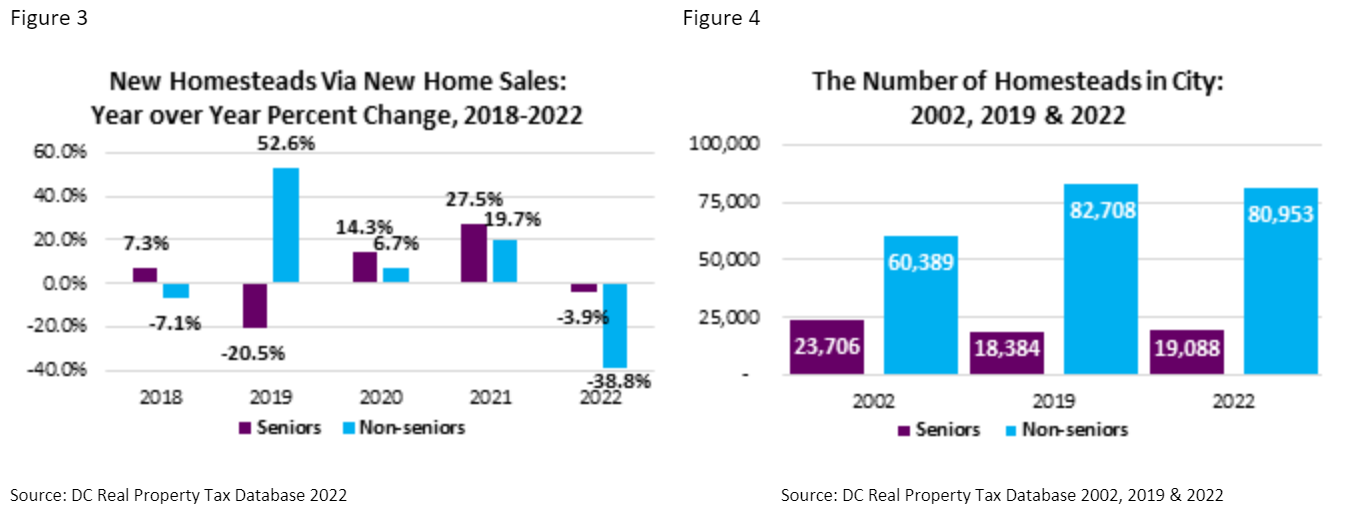
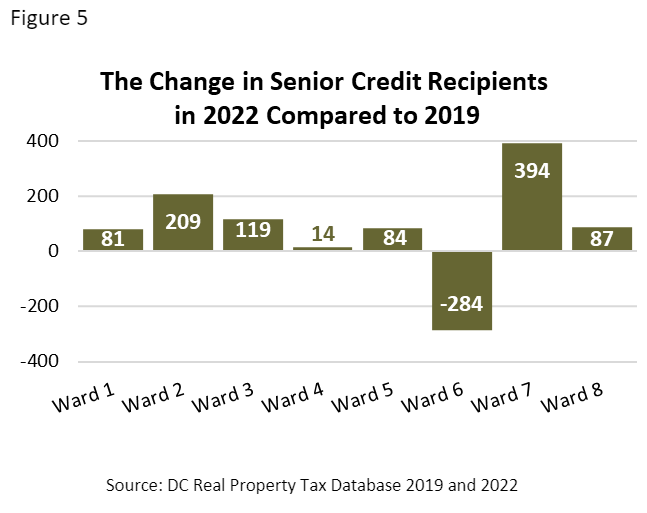
Various factors can explain the establishment of new homesteads in a given year. One major factor is homeowners who purchase a new home and apply for and receive homestead or senior homestead designation in the same year. Figure 3 shows the annual change in new home sales that also received homestead designation in respective years. The figure shows that the District gained new senior and non-senior homestead claimants in 2020 and 2021 via new home sales, but the number of new sale claimants for both categories declined in 2022. The increase in homestead claimants via new home sales in 2020 and 2021, followed by a decrease in 2022, is likely the result of rising interest rates in 2022 after historically low interest rates in the previous two years. But in the aggregate, there still was a 3.8 percent (704) net increase in all senior homestead claimants in 2022 compared to 2019 (Figure 4).
Figure 5 shows that Ward 7 accounted for over half of the net increase in senior homestead claimants between the two years.
To increase participation in senior homestead tax relief, the Office of Tax and Revenue Real Property Tax Administration (RPTA) recently launched an outreach program. Starting in January 2020, RPTA annually identifies all homestead owners who are age 65 and over but do not receive the senior credit and sends them a personally addressed courtesy letter informing them that they are likely eligible for the senior credit. The letter encourages them to complete and submit an online application if they meet the qualifications for joining the senior credit program (See here).
Economic and Demographic Characteristics of Homestead Claimants: Senior vs. Non-Senior
In 2021, the median age of senior citizen homesteaders was 73 years of age, while the median age of non-senior homesteaders was 37 years of age (Figure 6). Figure 7 shows that in 2022, the median senior homestead had approximately 6.6 percent less living area than the median non-senior homestead. (Note: The data in Figure 7 pertains exclusively to single-family structures and does not include condominiums or cooperative units.)
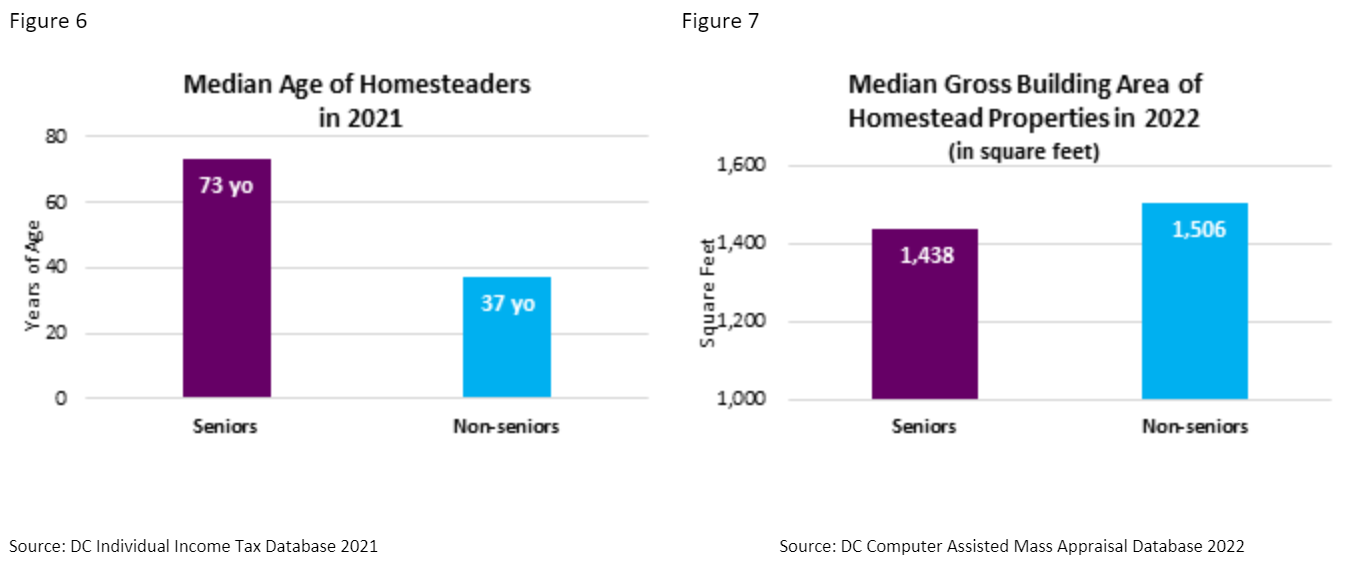
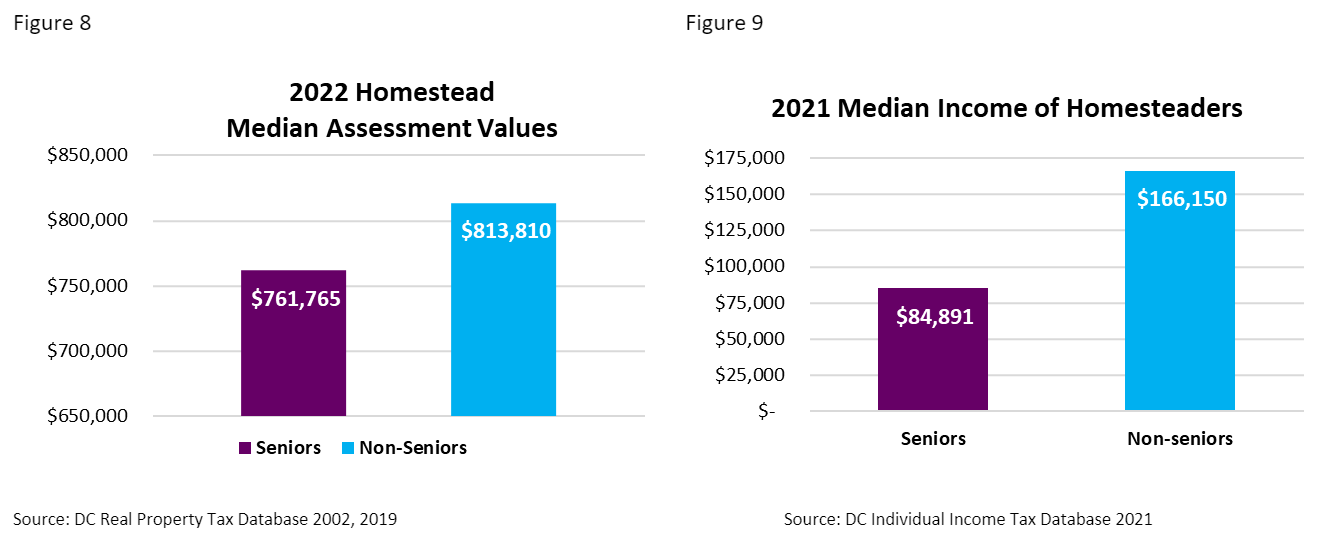
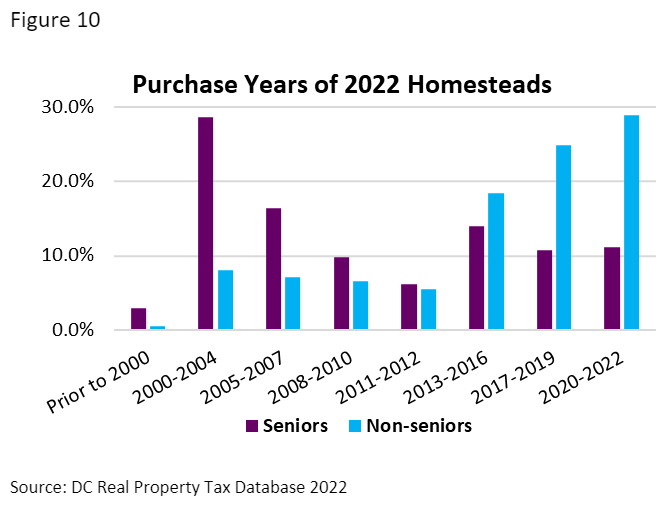
Figure 8 shows that the 2022 median assessed value of senior homestead properties was 6.4 percent lower than that of non-senior homesteads, and the 2021 median income (the most recent available income data that we could match to real property tax data) for senior homesteaders was 48.9 percent lower than that of non-senior homesteads (Figure 9). The analysis finds that in 2022, 72.1 percent of non-seniors bought their homes after 2012, while 48.0 percent of senior homesteaders purchased their homes before 2008 (Figure 10).