
We recently released our annual tax burden study for the DC metro area, which compares the state and local taxes a hypothetical family of three would pay in DC and surrounding jurisdictions. This year’s report covers taxes from tax year 2022.
We calculate the income, property, auto, and sales taxes a hypothetical family would pay at household incomes of $35,000, $50,000, $75,000, $100,000, $150,000, and $250,000. The income levels of $35,000 and $250,000 are new in this year’s report; in previous years, the lowest income we analyzed was $25,000, and the highest was $150,000.
Our main findings include:
· A hypothetical family in DC had a lower total tax burden (income, property, auto, and sales tax combined) than the average of surrounding jurisdictions for all income levels we analyzed.
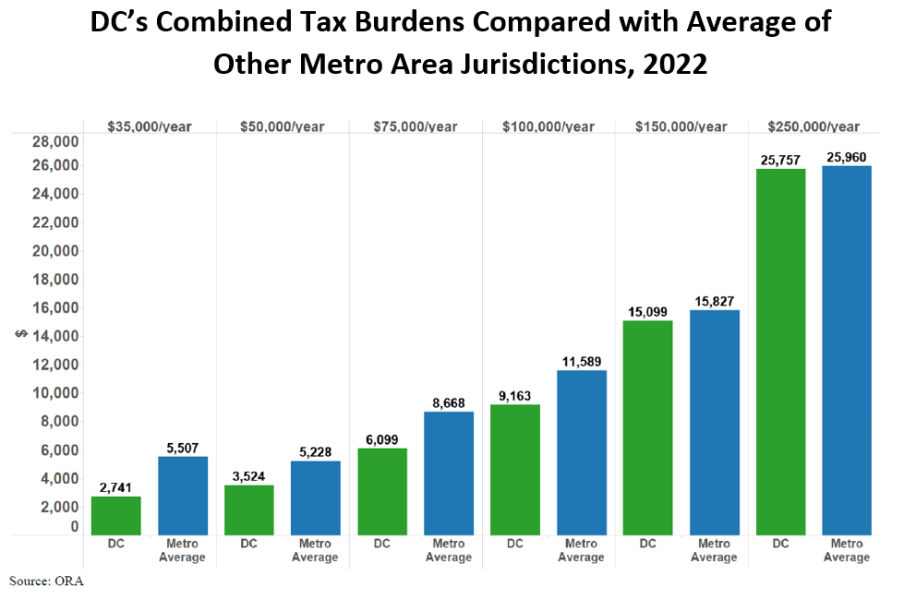
· The total tax burden (income, property, auto, and sales taxes combined) for families with incomes up to $100k was lower in DC than in all other surrounding jurisdictions.
o For a family with a $150k income, the total tax burden in DC was 6th highest out of 8 jurisdictions.
o For a family with a $250k income, the total tax burden in DC was 4th highest out of 8 jurisdictions.
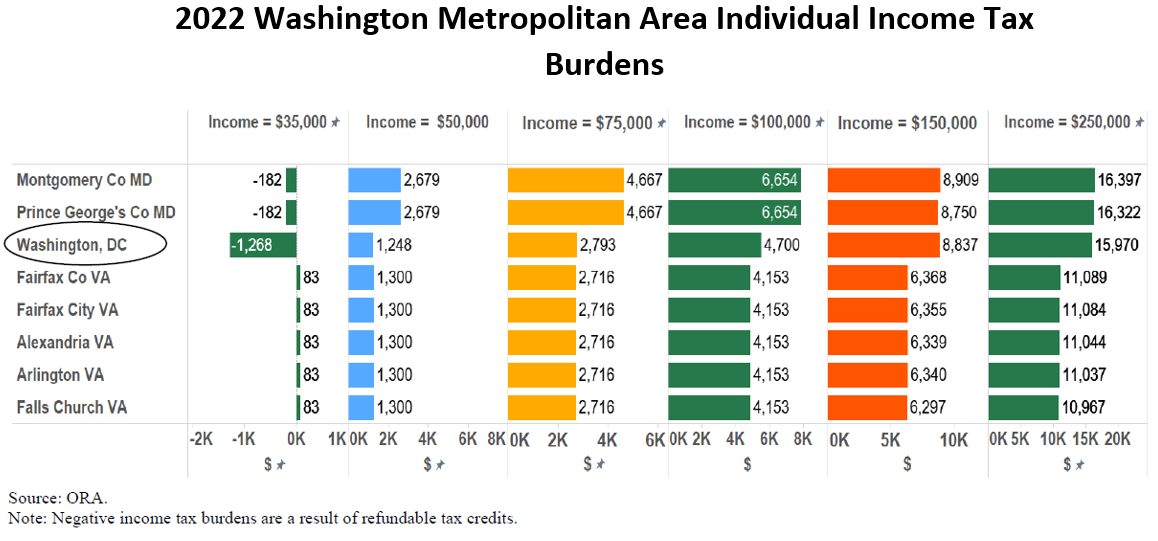
· Income tax: Compared to surrounding jurisdictions, DC had the lowest burden for the lowest income family analyzed ($35,000 income), and the 3rd highest burden out of 8 jurisdictions for the highest income family analyzed ($250,000 income).
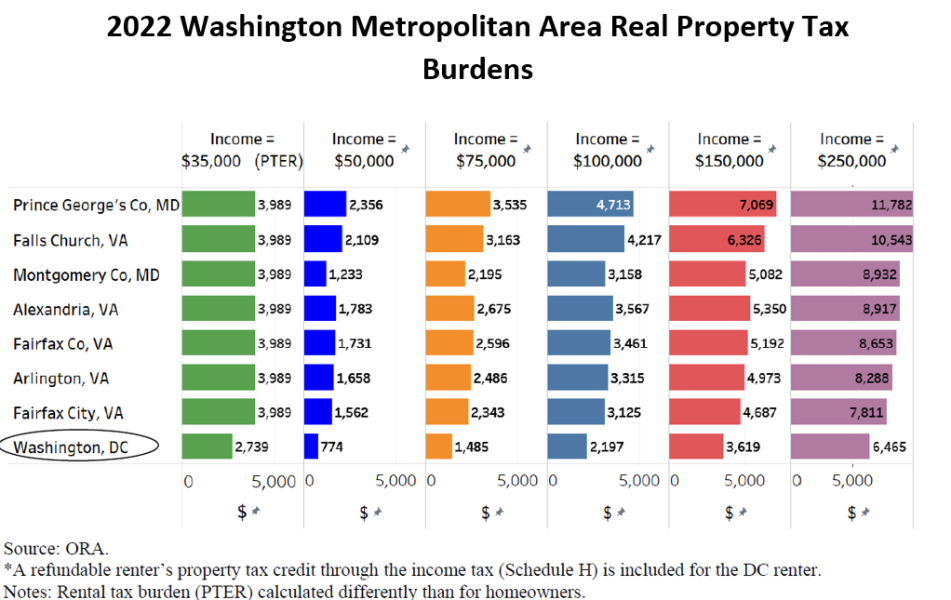
· Property tax: DC had the lowest property tax burden compared to all surrounding jurisdictions for all income levels we analyzed.
o In addition to having the lowest property tax rate of jurisdictions analyzed, DC also offers the homestead deduction and Schedule H tax credit.
· Sales tax: DC had the highest sales tax burden compared to all surrounding jurisdictions for all income levels we analyzed
· Auto tax: DC had the lowest property tax burden compared to all surrounding jurisdictions for all income levels we analyzed.
· In addition to the tax burden calculations, our report includes comparisons of tax rates in the DC metro area, including those for alcoholic beverages, gas, cigarettes, financial institutions, inheritances and estates, unincorporated business franchises, and more.
Read the full study or browse our complete list of tax burden studies