
Part 1: Employment and population
What happened to District employment?
The District is facing a significant downsizing of the federal workforce, which is its largest source of employment, accounting for about a quarter of all jobs in the District. This is much like what occurred over 30 years ago during the Clinton administration's "National Partnership for Reinventing Government" initiative, launched in 1993 under the leadership of Vice President Al Gore. The goal was to "make government work better and cost less," resulting in notable downsizing, restructuring of agencies, and a focus on improving efficiency.
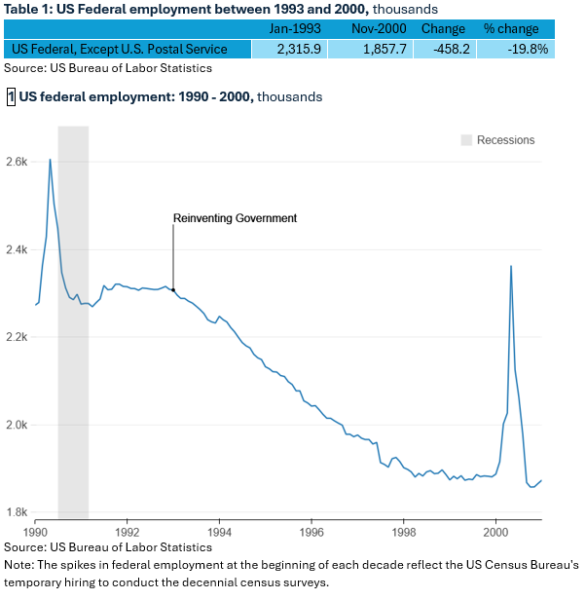
Between 1993 and the end of 2000, federal employment, excluding the postal service and defense, fell by nearly 460,000 jobs, or about 20% (Table 1 and Chart 1). In 1993, non-postal, non-defense federal employment was just over 2 percent of total U.S. employment, but it was about one-third of District employment (Table 2). This means that falling federal employment over the period, as we will show, had a disproportionate impact on the District’s economy. In a series of blog posts, I will explore the impact of federal downsizing on the District in the 1990s, specifically examining the impact on employment and population, income and wages, and local District revenue during that period. In this first post in the series, I focus on employment and population.
| Region | Federal | Total | Share |
|---|---|---|---|
| US | 2,307.6 | 109,790.0 | 2.1% |
| DC | 234.2 | 678.6 | 34.5% |
Source: US Bureau of Labor Statistics
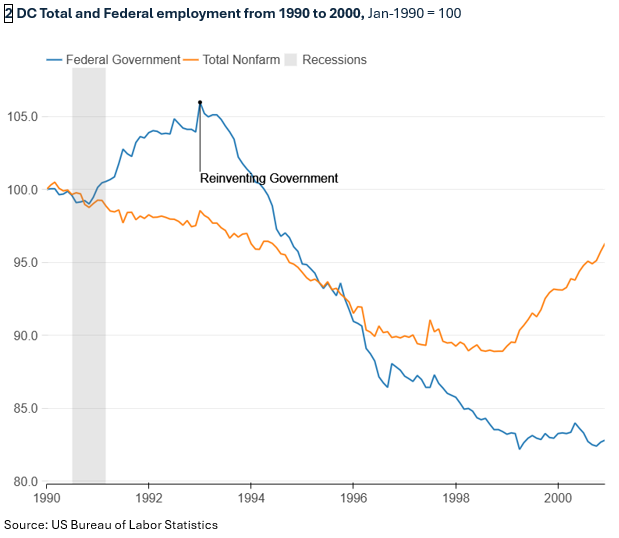
From its peak of 234,000 in January 1993, federal jobs in the District decreased by 52,000 (22%) to 182,000 by October 2000. Overall, the District experienced a loss of about 80,000 jobs (12%) between March 1990 and December 1998 (Table 3). Note that federal employment increased during and after the recession from mid-1990 to early 1991, even as total jobs declined and continued to fall just after the recession (Chart 2). The decline intensified as the federal government started to cut positions after 1993. For the decade, the District lost 47,000 total jobs, or 7% of the jobs located in the District, as a pickup in job growth towards the end of the decade offset some of the loss.
| Employment Sector (Date Range) | Peak | Trough | Change | % change |
|---|---|---|---|---|
| Federal (Jan-1993 to Oct-2000) | 234.2 | 182.1 | -52.1 | -22.2% |
| Total (Mar-1990 to Dec-1998) | 692.0 | 612.2 | -79.8 | -11.5% |
Source: US Bureau of Labor Statistics
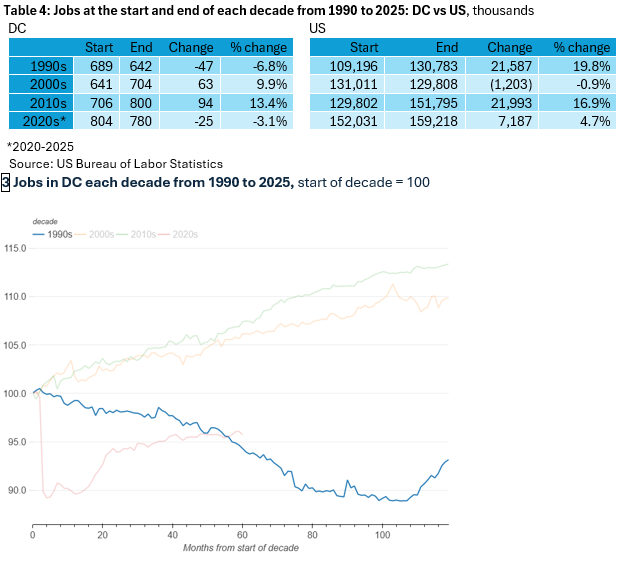
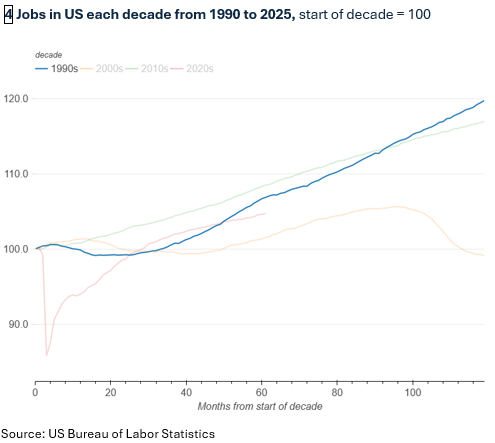
Job losses in the District during the 1990-2000 decade were a local phenomenon, occurring when employment was booming nationally (Charts 3 and 4). In contrast to the 7% job decline in the District, total employment in the United States increased by 20% during the 1990s (Table 4). Generally, job growth nationwide outpaced the District's in each decade since 1990, except for the 2000s. The 2000s were different because of the Great Recession. During the Great Recession, job growth slowed more sharply across the nation than in the District. This was primarily due to the federal government increasing hiring and spending following the financial crisis that precipitated the Great Recession.
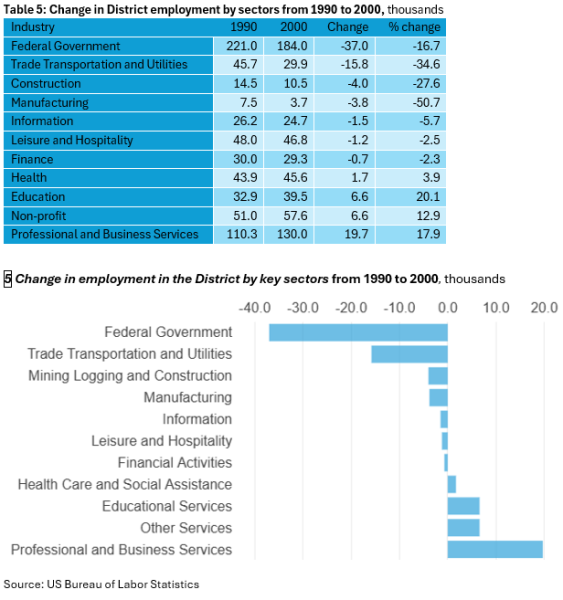
The reductions in the federal government workforce were a significant factor in the decline in total employment in the District during the 1990s (Table 5 and Chart 5). However, given the importance of the federal government to the District’s economy, it is not surprising that other industries suffered job losses as the federal workforce shrank. Trade, Transportation and Utilities, Construction, Information, Leisure and Hospitality, and Finance were among the industries that lost jobs. Meanwhile, the Professional and Business Services sector grew, as many federal workers were replaced by contractors. Other industries that added jobs during this period included Education, Health, and Non-profit sectors. These are industries that were not as dependent on the federal sector.
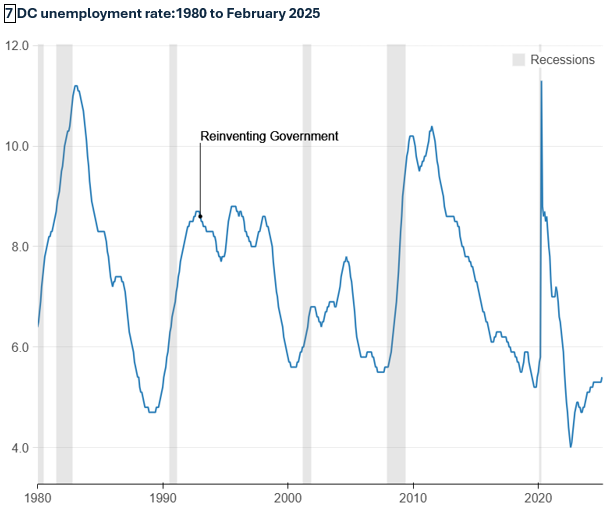
The 1990s were also the worst decade for employment among District residents in the decades from 1980 to the present (Table 6 and Chart 6). During the 1990s, employed District residents shrank by as much as 17% before a partial recovery in the latter part of the decade. Employment levels ultimately ended up 8% lower than at the beginning. This was the only decade covered here when the number of jobs for District residents was lower at the end than at the start. The District's unemployment rate remained high throughout the 1990s following a brief recession that ended in early 1991 (Chart 7). Unlike previous economic downturns, where unemployment rates decreased following a recession, the District's unemployment rate stayed elevated for most of the decade, even as the US unemployment rate fell as the national economy grew.

What happened to the population?
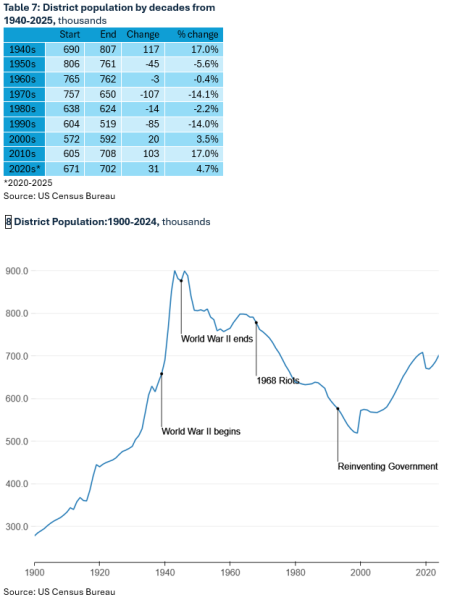
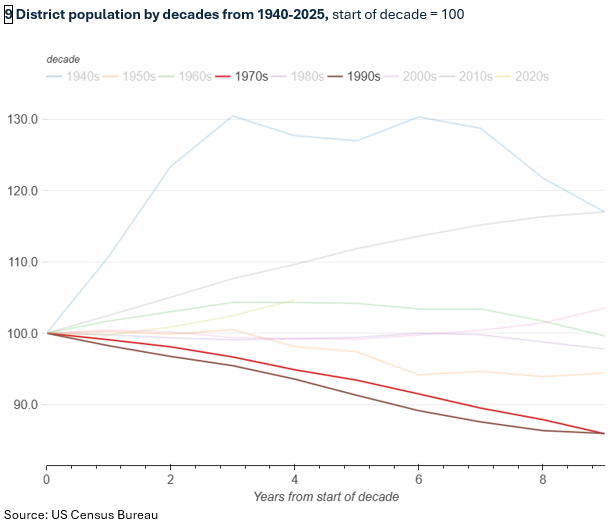
The District's population peaked during World War II as the federal government expanded in response to the war effort. After the war ended, the population began to decline, although there were brief periods of stability and increases. Following the riots in 1968, the population experienced a steep decline that continued until the beginning of the twenty-first century, only stabilizing briefly in the 1980s (Chart 8). The population was already in decline before the federal workforce reductions, but the workforce reductions exacerbated the decline. The population decline during the 1990s was as severe as in the 1970s when residents fled the District following the riots in 1968. In fact, for much of the 1990s, the rate of population loss was higher than in the 1970s. This is not to say that the federal workforce was the leading cause of the population decline. Many forces were at work in the District’s population decline since the 1940s: the war's end, the suburbanization that accompanied the building of the highway system, the 1968 riots, bigger houses, less crime, and higher quality schools in the suburbs, among other factors. However, the job reductions would have been a contributing factor, with fewer people being attracted to the region and the District as jobs disappeared.
Concluding remarks
What does the District's economic performance in the 1990s, following significant federal workforce cuts, suggest about the potential impact of current federal downsizing? The District's economy has changed in some ways since then. Federal employment now accounts for a quarter of the workforce, compared to one-third at the beginning of the downsizing in the 1990s. This shift is a direct result of that downsizing.
Much of the employment growth since the 1990s has occurred in Professional and Business Services, primarily involving federal contractors. This trend emerged as the federal downsizing replaced federal workers with contractors, which helped to cushion the overall decline in employment. However, if the current federal downsizing also reduces federal contracting, the impact on overall employment could be more severe than it was in the 1990s.
On a positive note, the District's population has been growing since the 2000s and is currently at its highest level since the mid-1970s. The District's ability to continue attracting and retaining residents will depend on its capacity to create new job opportunities as federal and possibly contracting jobs are lost. To achieve this, the District must leverage its core strengths, which include a highly educated workforce, good transit infrastructure, good universities, national monuments, world-class museums, and its status as an international city.
What is this data?
This analysis is based on employment statistics from the US Bureau of Labor Statistics (BLS) and population data from the US Census Bureau, which were retrieved from the Federal Reserve Bank of St. Louis Federal Reserve Economic Database (FRED®) system.