

The District of Columbia’s apartment market has experienced some remarkable changes over the last 24 months. Notably, the vacancy rate for market rate apartments in the District rose from 6.9 percent in fiscal year 2019 to 10.6 percent in fiscal year 2020 and 8.7 percent in fiscal year 2021 (See here). Apartment rents declined 12.4 percent in 2020 only to increase 12 percent in 2021 (See here), and almost 20,000 fewer residents (of which at least 9,000 may be permanent) resided in the District in 2021 compared to 2020 (See here and here). Coincidentally, the almost 20,000 fewer residents in 2021 (as reported by the U.S. Census) appears to stand in stark contrast to the 9,432 additional new apartment units occupied in the same year as reported by CoStar (See here). But, all of this only underscores the considerable volatility and perplexity of the local economy over the past two years. These dramatic fluctuations were caused by the pandemic. But, this blog highlights a study released in January 2020 (See here) that argues that these same factors were not only appreciably varying pre-covid but were also shifting both the District’s demand and supply curves for market-rate apartment units.
Given that the District’s economy experienced sizable fluctuations in 2020 and 2021 that were considerably more dramatic than estimated in the study, this does not preclude an eventual rebalancing of the apartment market over the next 36 months or so in such a way that the District will have approximately 65 percent more apartment units in 2025 compared to 2018 but only 2.3 percent higher average rents for new renters. The study also estimates that average market rents for new renters in 2025 will be about 4.9 percent less than the scenario where the District does not build 36,000 new units between years 2019 and 2025. In sum, despite the economic volatility of 2020 and 2021, the long-term average District rent curve continues to appear to be bending downward in favor of new renters, which tend to be new city residents, young professionals and recent college graduates (See here).
A Rapid Market Expansion
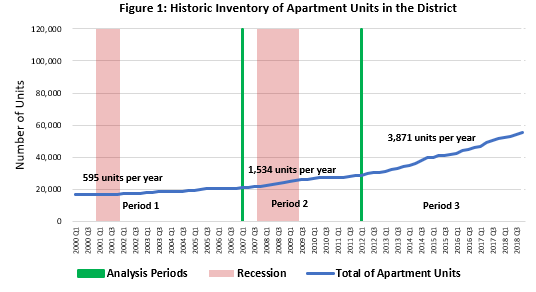
According to the study, the District had a total of 16,476 one-bedroom and two-bedroom units in large class A and class B multifamily buildings in 1999 but a total of 55,414 units in 2018 (236.3 percent increase). That is, a total of 38,938 new apartment units were added, with an average of 2,049 new units added per year throughout the 19-year period. When the entire study period is divided into three phases, there was an annual average of 595 new units delivered in years 2000 to 2006, an annual average of 1,534 units delivered in years 2007 to 2011 and an annual average of 3,871 units delivered in years 2012 to 2018 (Figure 1).
Policy Simulation #1
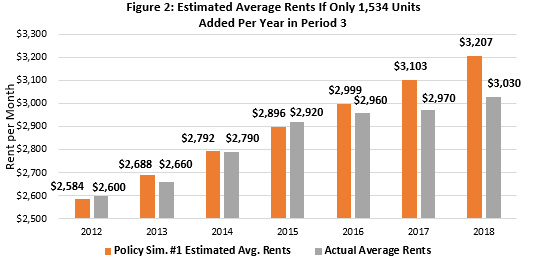
Using an economic model, we conducted two policy simulations. The first simulation answers the question: If the District had continued to add an annual average of only 1,534 units for years 2012 to 2018 (instead of the 3,871 units that were added), what would the effect have been on the District’s average apartment rent (controlling for other factors)? We found that the increase in the number of delivered units reduced average market rent in 2018 by $177 (5.52 percent) per month across the District (Figure 2). In other words, the acceleration in the delivery of new apartments slowed rent growth.
Policy Simulation #2
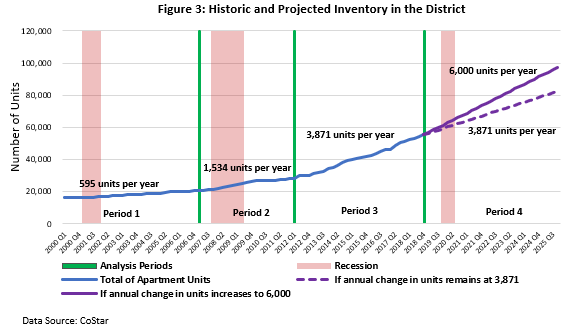
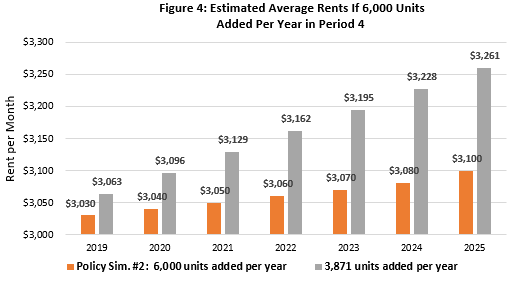
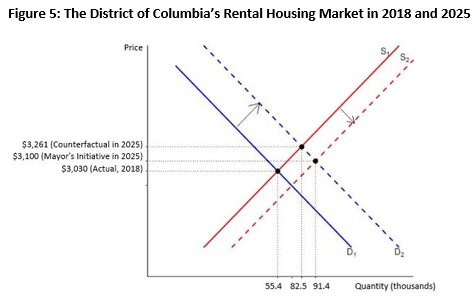
Figure 3 shows that the District (see here) and industry analysts are planning for an even significantly higher average annual increase in new apartments than in past years. The second policy simulation in the study answers the question: If the District continues to add an annual average of only 3,871 units instead of the 6,000 units annually that are planned for years 2018 to 2025, what would the effect be on the District’s average apartment rent in 2025? We found that renters across the District would pay $3,261 per month instead of $3,100 per month, an increased cost of $161 illustrating the importance of adding new rental supply to the District market (Figure 4). Stated differently, the average market rents in 2025 for new renters that year will be paying about $1,932 (4.9 percent) less in annual rents compared to estimated rents if the city does not build approximately 36,000 new units by 2025.
As the calculations were run before the COVID-19 pandemic and before the 2020 census, this second simulation assumed the District’s annual average population growth rate would slow from 2.6 percent in the 2011 to 2019 period to a little less than one percent in the 2019 to 2025 period. However, the US Census decennial enumeration in 2020 reported the District population of 690,000, roughly 18,000 lower than previously thought in 2019. In July 2021, that number was further reduced to 670,000. However, this estimate for 2021 may represent a temporary pandemic-related spike in outmigration given that 1) recent US Postal service data suggest as many as 50 percent of DC out-migrants during the pandemic may be temporary (See here); and 2) the apartment rents grew fastest (and vacancy rates dropped to their lowest) in the past 24 months in fall 2021. Additionally, CoStar reports that the District added 4,930, 6,129 and 4,995 net new apartment units in large class A and class B multifamily buildings in years 2019, 2020 and 2021 respectively.
Estimated Demand and Supply Curves
Amidst the current flux in some key economic factors and underlying dynamics, the study argues that fundamental factors are shifting both the demand and supply curves for the District’s apartment units outward (to the right). And, that it will trend towards a new equilibrium with about 36,000 (65 percent) more apartment units but only 2.3 percent higher average rents for new renters in 2025 compared to 2018, as illustrated in Figure 5 below.
Conclusion
So, while the District may have had more than 20,000 fewer residents in 2021, as well as higher apartment vacancy rates and lower apartment rents than at the beginning of the pandemic, the pandemic and some of its direct repercussions may have made more volatile some trends that pre-dated the pandemic (i.e. slowing annual rent increases, a continuous supply of new unit deliveries, and lower population levels and annual growth rates).
On the whole, the District is in an existential housing affordability crisis and elevated market apartment rent levels are proving prohibitive for some and causing many other current renters to be rent-burdened. Nevertheless, continually adding thousands of new additional apartment units annually is also proving to bend the long-term average District rent curve downward in favor of new renters.