
This blog expands on our review, here, of the DC Earned income tax credit (DC EITC) looking at the distribution of DC EITC recipients by income, qualifying children and childless workers, and the geographic location. The benefit is concentrated among working families with dependents earning between $10,000 to $25,000 between 2006 and 2017. Additionally, more than a third of DC EITC recipients live in Wards 7 and 8.
Distribution of Credits by Income
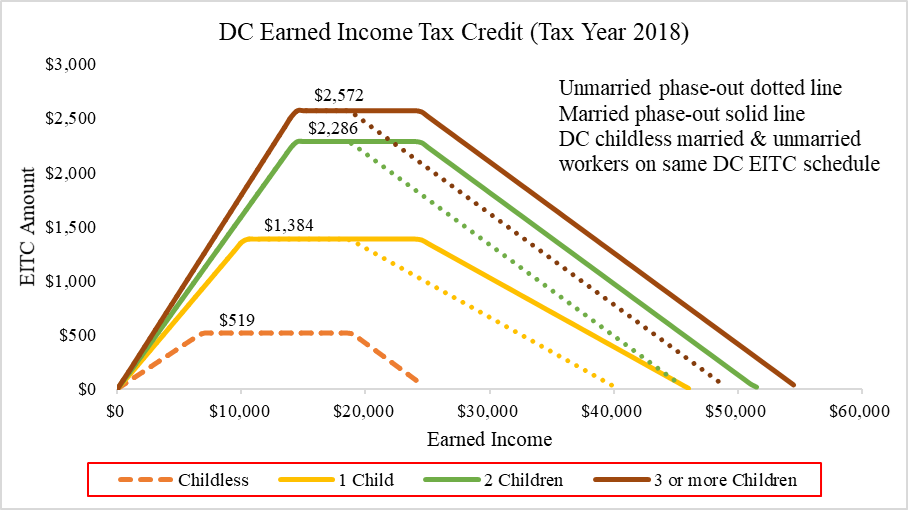
From 2006 to 2017, most (78 percent) DC EITC recipients reported a DC adjusted gross income (DC AGI) of less than $25,000. Recipients with incomes between $10,000 and $25,000 benefitted the most, receiving on average over $1,000 per year in refundable credits between 2006 and 2017. This corresponds to the phase-in range of the program and decreasing at higher income levels with the phase-out range of the program (shown in Chart 2 below using the 2018 DC EITC schedule).
Chart 1: Median EITC by DC AGI 2006-2017
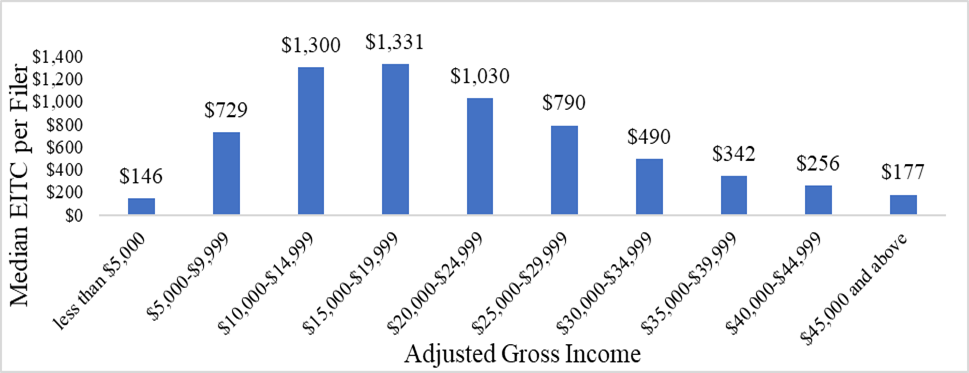
Source: ORA
Chart 2: DC EITC Schedules, 2018
Distribution of Credits Between DC EITC Filers with Qualifying Children and Childless Workers
Of all recipients from 2007 to 2017, those with one or two qualifying children accounted for 76 percent of the credit amount claimed (Table 1). Almost 70,000 children per year lived in households that benefitted from the DC EITC and 52 percent of those children lived in poverty during the same period. Overall, ORA found that about eleven percent of the children of EITC claimants living in poverty were lifted out of poverty because of the local earned income tax credit in the same 11-year period (further analysis of DC EITC benefit and its impact on children can be found in the “Income Security Tax Expenditure Review” Review of Income Security and Social Policy Tax Expenditures 2021 | ora-cfo (dc.gov).
Table 1: Total EITC Filers and Credits Claimed, by Number of Qualifying Children from 2007-2017
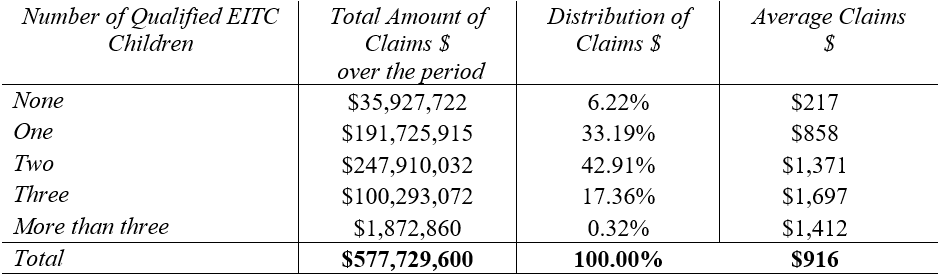
Note: ORA analysis of individual income tax data by number of qualifying children from 2007-2017. The total amount of claims by qualifying children do not equal the total claims because it excludes DC EITC recipients with missing information
.
Benefits for childless adults expanded in 2014
In 2014, the maximum benefit and income threshold for DC EITC childless workers was expanded, driving an increase in the number of childless workers that claimed the credit by about 33 percent—especially those with incomes between $14,850 (the federal income threshold for childless workers to claim the credit) and $24,254 (DC’s expanded income threshold), allowing childless workers with higher income who were not eligible for the federal credit to become eligible for the DC credit. The maximum benefit was also increased to 100% of federal rather than 40% for other filers with dependents.
Prior to the expansion of the credit, the share of childless workers on EITC averaged about 24 percent in 2013 and 2014, but they only received about 2.7 percent of the total distribution of the credit (Chart 3). As a result of the EITC expansion for childless workers, the share of childless workers as a portion of the total number of households on EITC increased to an average of 36 percent in 2015 and 2016. Additionally, the share of the credit amount received by childless workers significantly increased by over 400 percent to about 14 percent in 2015 and 2016 due to the increase in the share of federal credit from 40% to 100%.
Chart 3: Percent of Childless Population and Claim Distribution Before and After the Expansion (2013-2016)
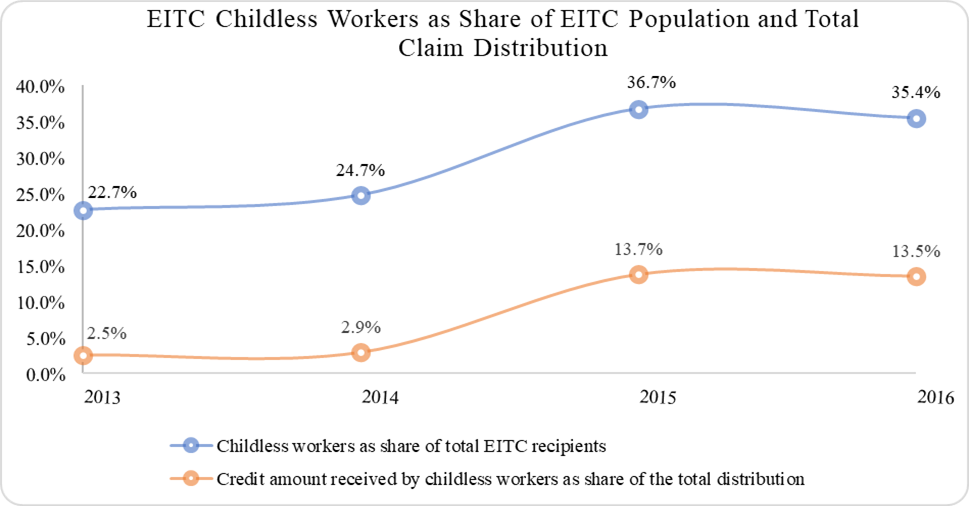
Source: ORA
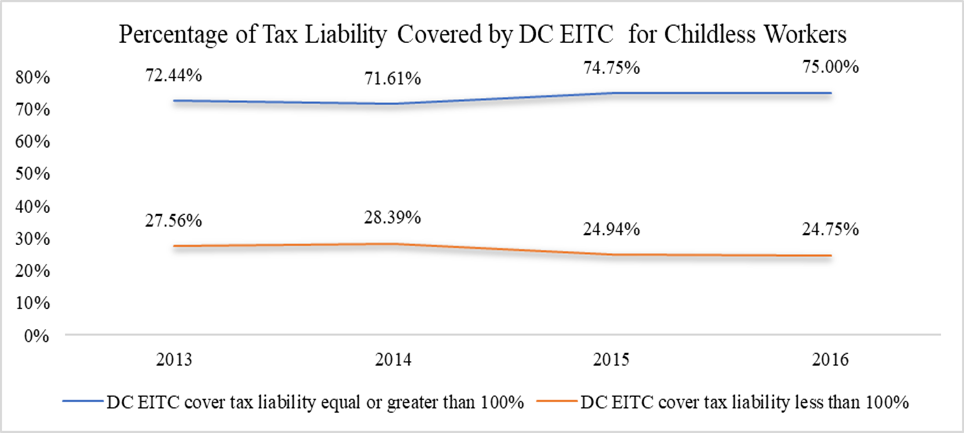
The expansion eliminated all tax liability for a higher percentage of EITC recipients without children shown by the upward bump in Chart 4 after the law became effective in 2015. Specifically, the law increased the number of childless workers whose tax liability would be completely removed by the credit by about an average of 3 percent while also decreasing the number of childess workers whose tax burden was partially eliminated by an average of 11 percent.
Chart 4: Percent of DC Tax Liability Covered by DC EITC Before and After the 2014 Expansion
Source: ORA
Distribution of Credits by Ward and Neighborhood
DC EITC recipients living in Wards 7 and 8 between 2001 and 2017 received the largest share of the credit—$278 million in credits or 45.3 percent of the total credit claimed over that period and accounted for the most claims processed. Among recipients in most wards, the most common filing status during the same time was ‘head of household’. In Wards 2, and 3, however, the most common recipient was a single filer (Chart 5 below).
Table 2: Total Number of EITC Households and Credits Claimed, by Ward from 2001- 2017
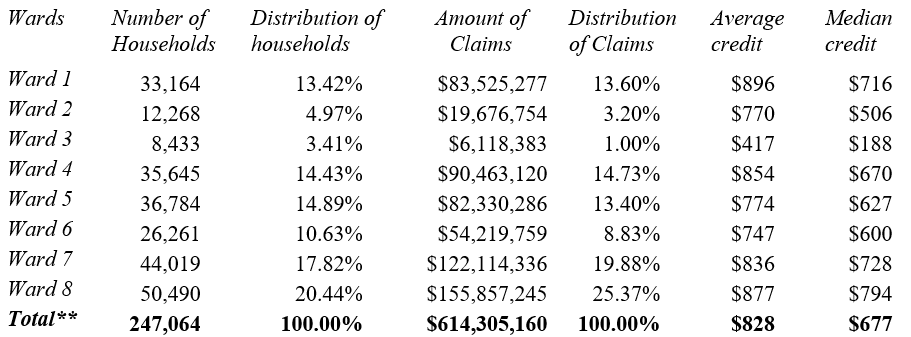
**Number of households does not equal total because it includes repeat claimants that moved to another Ward between 2001 and 2017. The claimant is therefore captured in both Wards at different time periods.
Note: ORA analysis of individual income tax data. The total credit claimed by Ward does not equal the total credit claimed by all DC EITC recipients because the addresses of some recipients were out of state, missing, or could not be geocoded.
Chart 5: Percent of DC EITC Filers by Filing Status and Ward
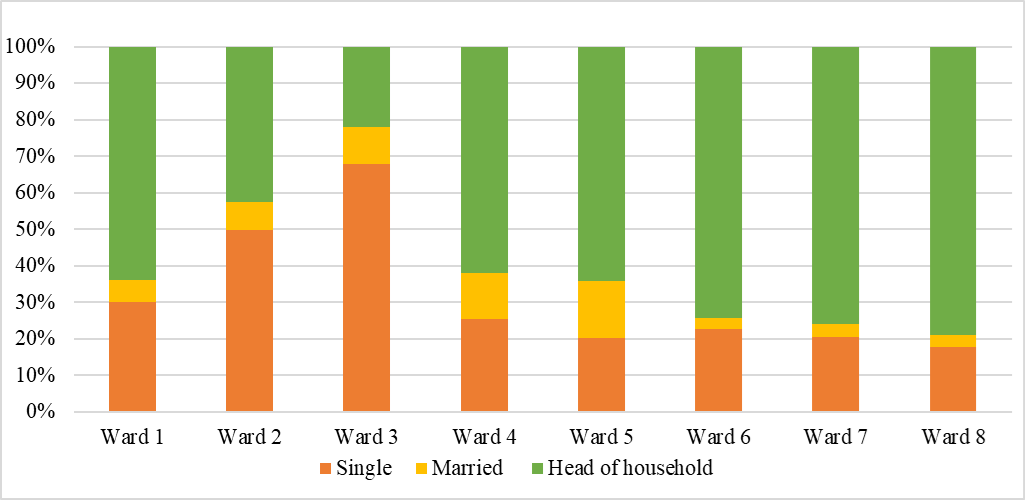
Source: ORA. Note: Head of household filers are unmarried filers with dependents.
Most of DC EITC recipients lived in only 20 of DC’s 74 assessment neighborhoods and claimed 92 percent of the total credit in 2017, as shown in Table 3 below. Nine of the top 20 neighborhoods, all located in Wards 7 and 8, made up 43 percent of DC EITC recipients and accounted for an estimated $275.7 million in credits between 2001 and 2017, or about 45 percent of the total DC EITC during that time with an average claim of about $855 per household per year.
Map 1 below shows the density per square-mile of DC EITC recipients per 1,000 tax filers in 2017. We control for the number of tax filers by neighborhood because some neighborhoods have a higher (or lower) proportion of DC EITC recipients in relation to the total number of tax filers in the same neighborhood. For example, while the Columbia Heights neighborhood is ranked third among neighborhoods with the highest number of DC EITC recipients in 2017 (see Table 3 below), the neighborhood is 18th for recipients as a share of all tax filers. Proportionally, a tax filer in Barry Farms in Ward 8 was almost three times more likely to claim the EITC than a tax filer in the Columbia Heights neighborhood.
Map 1: Neighborhoods by Share of EITC Claimed, 2017
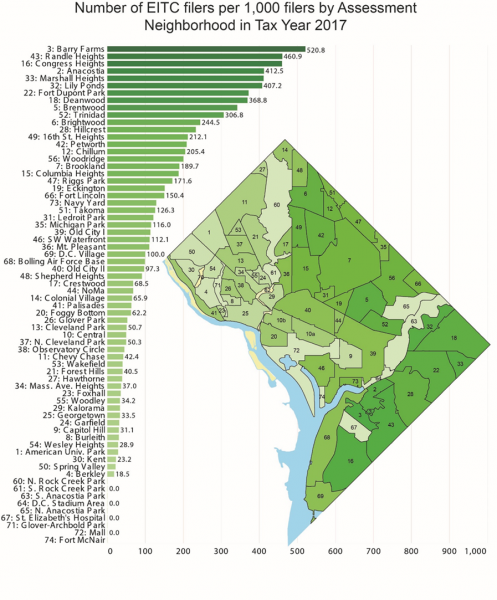
Source: ORA
Table 3: Total DC EITC Claimed by Top 20 Neighborhoods, 2017
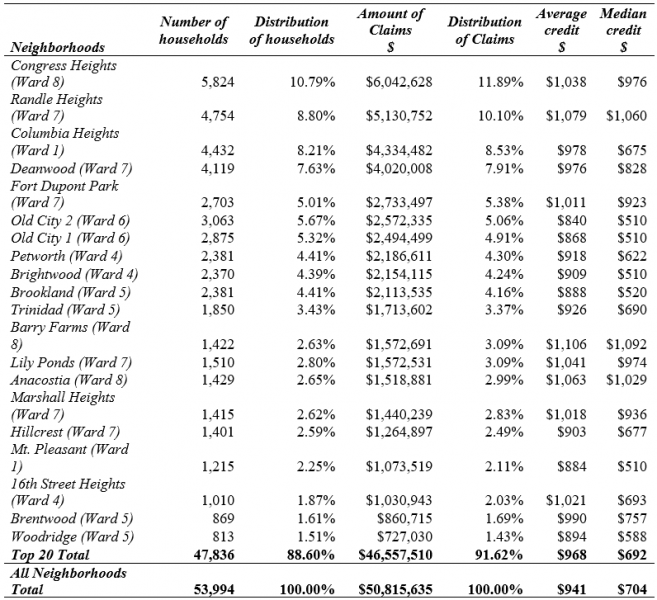
Note: ORA analysis of individual income tax data, 2017. The total credit claimed by neighborhood does not equal the total credit claimed by all DC EITC recipients and DC EITC recipients by Ward because the addresses of some recipients were out of state, missing, or could not be geocoded.
What is this data?
This study used DC individual income and federal individual income administrative tax data from 2001 to 2017. This data is geocoded and provides information on DC EITC claimants including amount claimed, and number of qualified dependents.