Each month, our office publishes a review of economic and tax revenue data for DC. The review includes data on employment and wages, residential and commercial real estate, hospitality, the US economy and federal government, and DC tax collections. Below are the highlights from our latest review.
Read the full review online or download a PDF of the review
Highlights from the May 2024 Review
Employment: DC jobs grew 0.3% over last year. Resident employment increased 3.6%. The DC unemployment rate was 4.6%.
Job Sectors: DC Public sector jobs are up 1.3% from last year. Private sector jobs are down 0.1%.
Wages: The federal government accounted for 28.6% of all wages in DC.
Population: At mid-year 2023, population was estimated to be 8,023 (1.2%) higher than the prior year.
Apartment Inventory: According to CoStar, the inventory of apartments and condominiums increased by 2.6% from a year earlier.
Office Space: According to CoStar, occupied office space declined 0.8% from last year and inventory was up 0.1%. The vacancy rate has risen to 16.8% (including sublet).
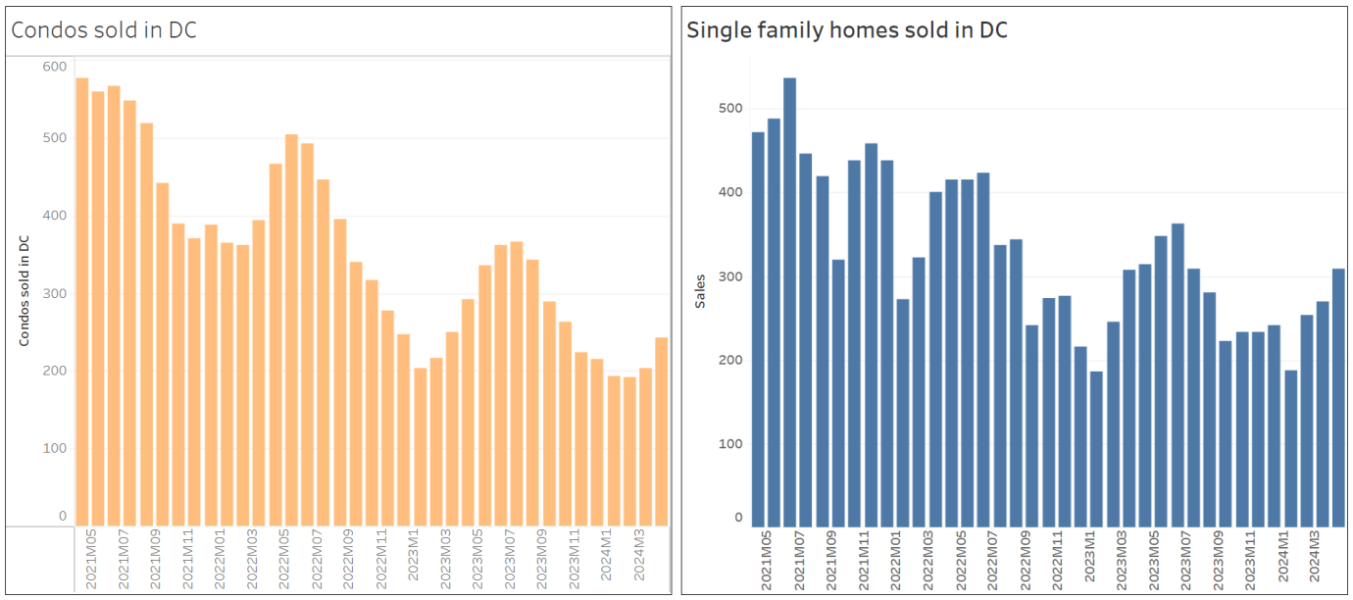
Home Sales: Single family home sales were down 1.6% from a year earlier, while the average price was 6.0% lower. Condo sales were down 6.4% from last year and the average price was 6.4% lower.
Hotels: There were 3.1% more hotel-room-days sold than a year ago (12-mo avg). The average room rate was down 0.1% (12-mo avg).
U.S. GDP: Compared to the same quarter a year ago, nominal GDP grew 5.9% and real (inflation adjusted) GDP grew 3.1%.
Tax Collections: Total tax collections are up 3.7% this fiscal year. Sales tax collections are up 8.6% this fiscal year.
Chart of the Month: The number of DC Single Family and Condo sales over time.