
The DC Government’s current economic development strategy as it relates to employment
Recent disruptions in the District's labor force and tax base have prompted the Office of Revenue Analysis (ORA) to analyze less-considered aspects of DC’s economic development policy,[1] such as workforce development and the tax system, and to evaluate the efficacy and equity of these policies. Conversations with national and local labor market experts highlighted the importance of wraparound services. Broadly, wraparound services are the financial support, life skills training, job placement services, and other supports that organizations, such as workforce training programs and community-based nonprofits, provide to individuals seeking to improve their livelihoods.
This is the second of a series of blogs introducing the concept of wraparound services, their research, and their context within the DC regional economy. In this series of posts, we will describe:
- An introduction to the concept, its definition, and context within DC’s economy;
- The DC Government’s current economic development strategy as it relates to employment;
- DC’s key labor figures and latest job market statistics by industry;
- An analysis of the targeted population in DC using tax data, identifying opportunities for other interventions, and, at the national level, highlighting a few case studies of successful wage-boosting workforce training programs that employ wraparound services.
Furthermore, in this series, we aim to establish the fitness and importance of this concept within DC’s broader economic development goal of boosting the economic well-being of disadvantaged working residents and industry, and to identify gaps and potential wins from a concerted effort to implement it as a feature of the wider system.
This post outlines and discusses the DC government’s current employment-focused economic development strategy. In a future post, we will describe an analysis of participants' outcomes in a decades-long DC training program with wraparound services. For more details on this topic and our research, please see the larger study published on our website.
The DC Government’s current economic development strategy in terms of employment
As with any smart plan, setting goals and measures, assessing challenges and opportunities, and focusing resources on strengths and emerging areas are paramount. According to DC’s current economic development strategy, the top 5 target industry clusters for predicted high employment and wage growth, particularly for people of color, are federal government services, consulting services, technology, education and research, and communication and design (see Graphic 1).[2] This plan was published in January 2023, but since then, many of DC's economic strengths, such as steady federal and consulting employment, have changed. Even so, there are still opportunities elsewhere, such as the tech industry, pivoting the highly educated, recently or soon-to-be unemployed federal workforce, and soon-to-be vacant federal real estate in DC.[3]
Furthermore, many jobs in this list of target industry clusters require a bachelor’s degree or are not considered high-average-wage industries, such as hospitality. This is important because jobs that require a bachelor’s degree are not accessible to job seekers who have not earned this level of college degree, and the hospitality industry offers many low-wage jobs that offer limited economic independence and exhibit high burnout and turnover rates.[4] Other targeted industry clusters, such as technology, construction, and business support functions, have been identified by ORA research as having high growth potential in the region and are likely pathways to high-paying jobs for residents without a bachelor's degree.[5] With the right training and support services, these areas could become economic assets.
Graphic 1: DC’s 2023-2027 Economic Development Strategy regarding employment
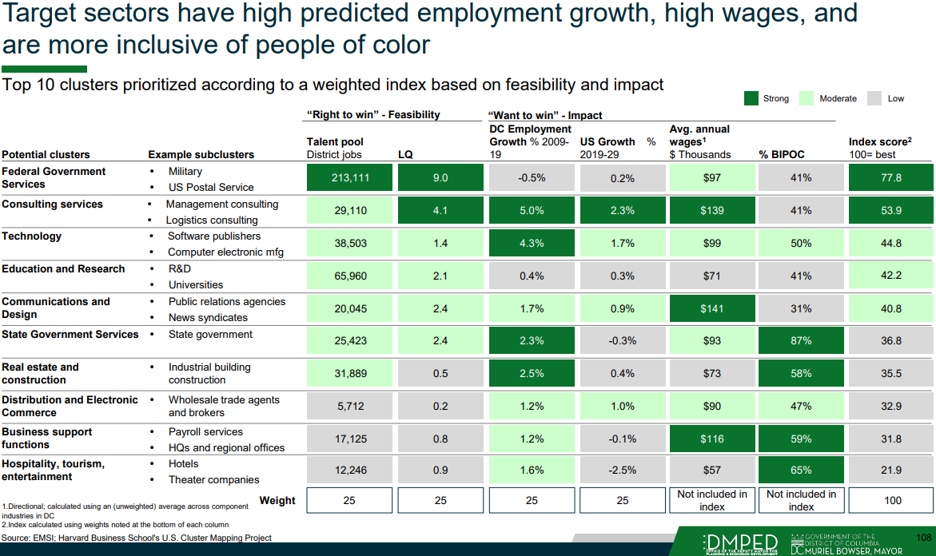
Source: The Office of the Deputy Mayor for Planning and Economic Development’s DC’s Comeback Plan, Pg. 108
Other parts of this plan include various proposed incentives for businesses and property developers. The plan also highlights incentive programs of other jurisdictions to attract these targeted industries to DC. Past expert analysis has found that this method has a modest impact on a jurisdiction’s economic development, specifically on the increase in the proportion of residents employed.[6] However, by incorporating best practices into the policy design of industry tax incentives,[7] along with the appropriate amount of funding for job access, i.e., pipelines to good jobs and support services, progress can be made for residents without the means for a college degree and for the economy.
In the third post, we will introduce key labor figures and job market statistics for DC and highlight industries we see as having potential for sustainable growth.
[1] This analysis came from and coincides with ORA’s soon-to-be-published second economic development-related tax expenditure review report.
[2] See page 108. Government of the District of Columbia, Office of the Deputy Mayor for Planning and Economic Development. DC’s Comeback Plan: Our 2023-2027 Economic Development Strategy. 2023
[3] Susan Steward, “A Deep Dive into Federal Job Loss in the District in 2025,” The DC Office of Revenue Analysis’ District, Measured Blog (2026), https://ora-cfo.dc.gov/blog/deep-dive-federal-job-loss-district-2025. U.S. General Services Administration, “Assets identified for accelerated disposition,” GSA (2026), https://www.gsa.gov/real-estate/real-property-disposition/assets-identified-for-accelerated-disposition.
[4] Richia McCutcheon, “We asked 500 frontline hospitality managers in the U.S. about the state of the industry. Here’s what we learned,” Axonify blog (2025), https://axonify.com/blog/hospitality-survey/.
[5] Kevin Hundelt, “Wraparound Services: Its Overview and Context in DC’s Economy,” The DC Office of Revenue Analysis’ Occasional Studies and Reports (2026), page 15, https://ora-cfo.dc.gov/publication/wraparound-services-its-overview-and-context-dc%E2%80%99s-economy.
[6] Timothy Bartik, Who Benefits from Economic Development Incentives? How Incentive Effects on Local Incomes and the Income Distribution Vary with Different Assumptions about Incentive Policy and the Local Economy, No. 18-034 (W. E. Upjohn Institute, 2018): Pg. 33-49, https://doi.org/10.17848/tr18-034
[7] Examples of tax expenditure policy design best practices include incorporating into the proposal or law routine audits, specifying agency responsibility, caps on benefits, clawback provisions, discussion of sunset dates, and data transparency mandates.