
Read our full report on housing tax expenditures here.
This is part three of our four-part blog series highlighting findings from our 2023 Housing Tax Expenditure Review Report. Tax expenditures, also called tax incentives, are preferences in the tax code that convey a benefit to individuals or businesses. Each post explains findings from our analysis of the four most significant DC housing-related tax expenditures: the homestead deduction for real property tax (part 1), property tax assessment increase cap credit (part 2), homestead deduction for senior or disabled residents (part 3), and the individual income tax credit for Schedule H (also known as the property tax circuit breaker) (part 4).
In this third post, we focus on the tax deduction eliminating 50 percent of the property tax for eligible senior and disabled homeowners in the District. We find that while the deduction gives homeowners a clear tax benefit, some eligible residents seem not to be claiming it, and the deduction is also regressive, providing a higher percentage of tax relief to higher-income homeowners.
We also provide background on how the deduction works and how the number of participants and amount of forgone revenue have changed over time.
The Senior or Disabled Homestead Deduction:
Eligibility
Senior citizens, or residents who are 65 years or older, and persons who are permanently and totally disabled who own and reside in the same home as their principal place of residence qualify for a 50 percent reduction to their annual District property taxes. Additionally, your household's total federal adjusted gross income for Tax Year (TY) 2022 must be less than $154,750 if you apply in 2024, and the property you select should have no more than five dwelling units. To apply for the program, you must submit an application to the Office of Tax and Revenue (OTR) only once.
Benefits to the Taxpayer
In TY 2022, 19,750 property taxpayers received the senior/disabled homestead deduction, reducing their tax liabilities by an average of $1,931, which resulted in about $39.6 million in forgone tax revenue.
This tax reduction is given on top of other property tax relief. Before the senior/disabled homestead deduction halves their property tax bill, a homeowner will first receive the homestead deduction for living primarily in their DC home (with an average value of $669 in TY 2022) and a tax credit that caps the annual increase in their home assessment (with an average value of $723 in TY 2022 for senior/disabled homeowners).
Chart 1 below shows the layering effect of property tax relief for a hypothetical senior or disabled homeowner in 2022 with a home valued around $500,000.
Chart 1: The Layering of Property Tax Relief for Senior or Disabled Homeowners – A Hypothetical Tax Bill in 2022, home value assumed at $500,940

Source: ORA analysis
For comparison, non-senior or non-disabled homeowners in TY 2022 received an average of $669 in tax relief from the homestead deduction for living primarily in their DC home, and $565 in relief from the cap on home assessment increases. The home assessment increase cap is 10% annually for most homeowners, but it is lower for seniors and disabled homeowners. It was 5% for senior/disabled homeowners in TY 2022 and years prior, and in TY 2023, it was lowered to 2%.1
How we got here:
When the senior homestead deduction was enacted in 1986, the District’s population and tax base had shrunk. The effects of technological advances like cost-effective personal automobiles and societal unrest had sapped DC of many of its middle to high-income residents, who migrated to the suburbs. Policymakers attempted to compensate for lost revenue by increasing real property taxes for remaining residents. The senior homestead deduction was designed to protect seniors from higher taxes. As noted in the DC Council’s committee report establishing this program, “those most affected by assessment increases are senior citizens on fixed incomes, many of whom are in danger of losing their homes.”2 The crafters of the legislation intended to provide relief for seniors who receive retirement income or social security benefits as their sole means of support, and they intended that individuals who earn income from investments would not be eligible for relief. However, it left the rule-writing process to the administrators. A maximum income limit of $100,000 was set in 1992. Disabled residents were included in 2006. In 2014, the income limit was increased to $125,000 and became subject to an annual cost-of-living adjustment. In 2019, a 5 percent cap on annual assessment increases was introduced, but it was lowered to 2 percent in 2023.
Impact of the Senior/Disabled Homestead Deduction:
Forgone Revenue in TY 2022
Forgone revenue for the senior or disabled resident homestead deduction in TY 2022 accounted for 18.6 percent of the total housing tax expenditure category.3 It was the third-largest tax expenditure in this category, falling short of second place by a margin of just 0.1 percentage point.
Since TY 2015, the number of beneficiaries has remained around 19,000. However, the program's total cost has grown each year, reaching $39.5 million in TY 2022. This is because, with the benefit calculated as 50 percent of a beneficiary’s tax liability, the value of the benefit increases with increases in property values. This is in keeping with the policy's intent to keep taxes relatively low for seniors in the face of rising assessed values.
There was an additional expenditure of $10.3 million in forgone revenue in TY 2022 from the cap on annual increases in property assessments for senior/disabled homeowners.
Trends in Program Participation and Cost
From 2002 to 2022, the number of seniors benefiting from the program fell from 23,707 to 19,060, though there has been a small uptick in participation in recent years. Several factors could explain the decline, including deaths, seniors migrating out of the District, or moving to non-homestead housing in the District that is more suitable to their changing needs. Potentially eligible seniors may also have been unaware of the program. According to data from the US Census Bureau's American Community Survey, the percentage of owner-occupied housing units owned by individuals aged 65 and above in DC increased by 1.4 percent from 2010 to 2022, suggesting that the decline in participation in the program may be due to a lack of awareness of the program among seniors rather than a decrease in the number of seniors in owner-occupied housing. For its part, OTR has recently increased its advertising efforts to identify and evaluate potential beneficiaries. Implementing the modernized real property tax system in 2020 has improved their identification process.
Whatever the explanation for the falling participation, chart 2 shows that despite declining participation, the program's cost has increased due to rising assessed value.
Chart 2: Average Assessed Value for Homestead, TY 2002 & 2022 by Ward
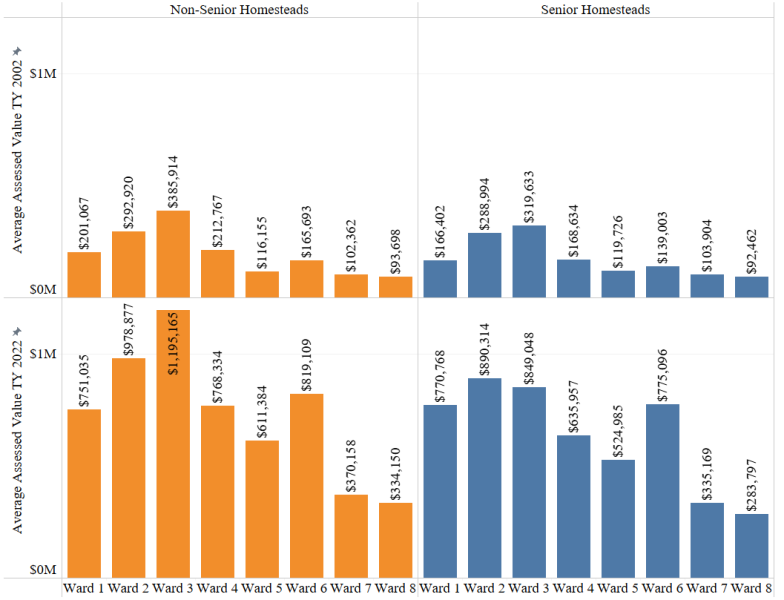
Source: ORA analysis of OTR real property tax data, October 2002 and March 2022.
Downsides: Eligible Homeowners Not Participating and Regressive Tax Rate
An analysis of available tax data shows that some homeowners who appear eligible for the senior/disabled homestead deduction are not taking it, despite the clear tax advantages it has. Table 1 shows a significant difference in effective tax rates between seniors who participate in the program and those who are eligible but do not receive the benefit.
Table 1 also demonstrates that the relief provided by the program disproportionately benefits higher-income households because they tend to own higher-valued homes, making the program regressive. The effective tax rates for the program decrease with income when the program is analyzed alone, without any other property tax relief, as shown in the table below (see yellow highlight). Because the senior or disabled homestead deduction is the last tax expenditure to be factored into the beneficiaries' tax bill, it halves less than the statutory tax amount, e.g., $0.85 per $100 of assessed value, which is why it shows a higher effective tax rate than $0.425 (half the normal rate) in the second to last column below.
Table 1: Effective Tax Rates of Matched 65 or Older Homesteaders by Homestead Type and Income Group, TY 2019 (yellow highlight shows regressiveness of senior/disabled homestead deduction)
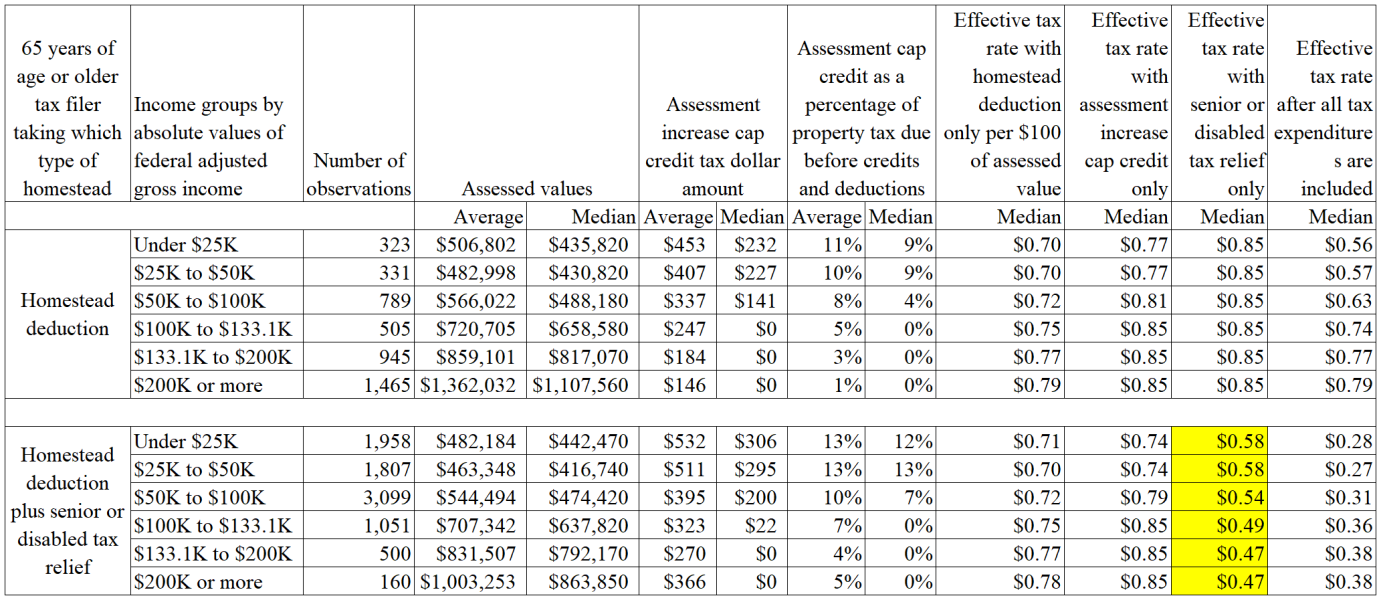
Source: ORA analysis of merged OTR individual income tax, real property tax, and OTR’s compiled homestead application data, 2019.
Disabled Beneficiaries Have an Effective Property Tax Rate Slightly Higher than Seniors
Out of the nearly 20,000 homeowners claiming the senior/homestead deduction in TY 2022, 690 (or 3.5 percent), were disabled. Table 2 shows that in TY 2022, the disabled beneficiaries of this program and had a higher median effective property tax rate than senior beneficiaries. Separate data on disabled beneficiaries is not available before TY 2021.
Table 2: Cumulative Effective Tax Rates for Homesteads by Type vs. Non-Homestead Residential Properties, TY 2022

Source: ORA analysis of OTR real property tax data, March 2022
Takeaways
In summary, the program is successfully achieving its goal of providing lower property taxes to senior and disabled homeowners on fixed incomes. However, the program's administration is quite complicated, and it tends to benefit homeowners with more valuable properties and higher incomes. We also have concerns about the program's effectiveness, as many eligible senior homeowners are not taking advantage of the tax relief, likely due to a lack of awareness of the program. However, the Office of Tax and Revenue has launched an outreach program to improve participation.
In the last installment of this blog series, we discuss the Schedule H circuit breaker income tax credit and offer descriptive analyses and visualizations to review its effectiveness against the stated goal.
What is this data?
The sources include real property public extract data (FY 2015-2022), individual income tax return data (FY 2015-2019), and a recently compiled list of approved paper or online homestead applications (FY 1978-2020) from OTR. Due to the lag in income tax return data availability, income and property tax matching was limited to FY 2019.
Endnotes
[1] The annual 5 percent assessment increase limit for senior or disabled resident homesteads became effective in TY 2019. Before then, all homesteads had the same rate.
[2] Council of the District of Columbia’s Report of the Committee on Finance and Revenue on Bill 6-476, “Real Property Tax Rates for Tax Year 1987” Pg 3.
[3] The senior or disabled homestead’s assessment increase cap credit was attributed to the assessment increase cap’s total forgone amount (part 2 of this blog series).